
FIGURE 1.
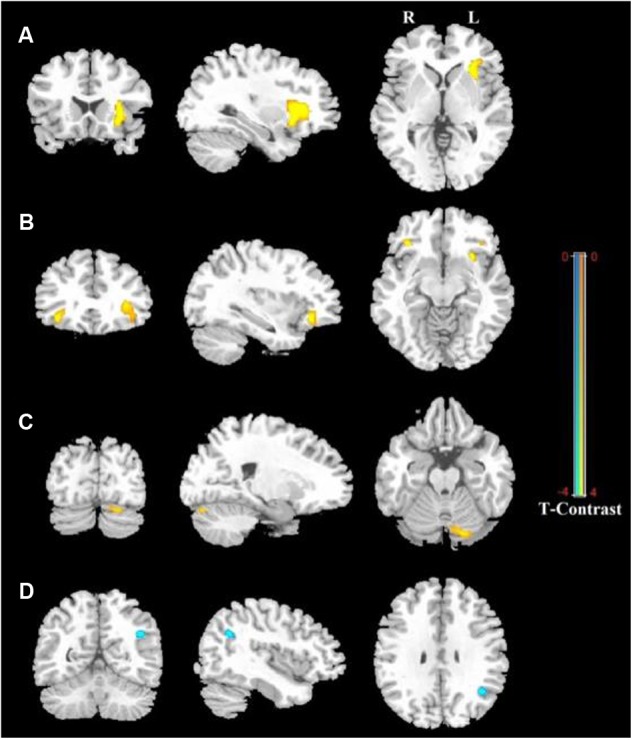
Regions showing significantly increased and decreased ALFF activity between males and females, with age and CBSS score as covariates. Yellow color indicates increased activity of the brain in males compared to females, and blue color indicates decreased activity of the brain in females compared to males. (A) Left Inferior Frontal Gyrus (LIFG), (B) Right Inferior Frontal Gyrus (RIFG), (C) Left Cerebellum Posterior Lobe (LCPL), (D) Left Inferior Parietal lobule (LIPL). The statistical threshold was set at p-value < 0.001, cluster size > 22 mm3 (AlphaSim corrected). The figure is shown according to radiological convention.