Figure 4.
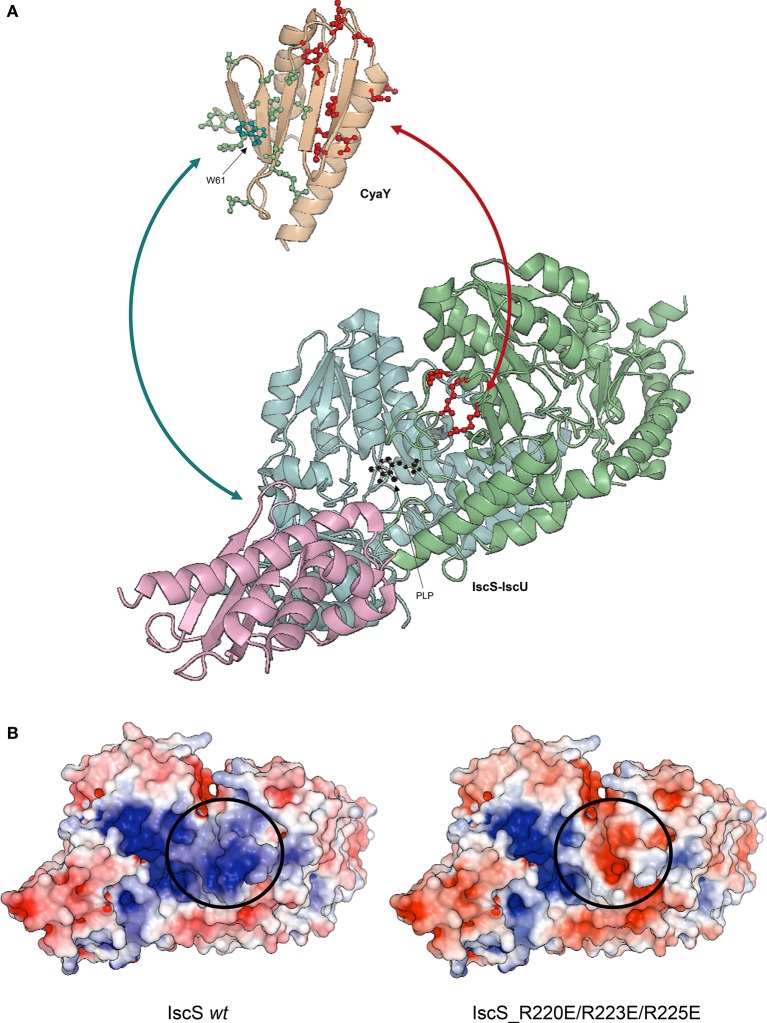
Ribbon representation of CyaY and IscS-IscU interactions. (A) IscU is shown in pink, while IscS monomers are colored in pale cyan and light green with side chains of residues mutated indicated explicitly: R220E/R223E/R225E (red). PLP in IscS active site is shown in black. Side chains of CyaY residues exhibiting CSP are explicitly shown: residues interacting with IscS are in red (Trp14, Leu15, Glu19, Asp22, Asp23, Trp24, Asp25, Asp27, Ser28, Asp29, Ile30, Asp31, Cys32, Glu33, Ile34, Leu39, Thr42, Phe43, Glu44, and Gly46), while residues interacting with IscU are in green (Thr40, Ile41, Lys48, Ile50, Asp52, Arg53, Glu55, Trp61, Leu62, Ala63, Thr64, Gln66, Gly68, Tyr69, and His70). (B) Electrostatic surface of unbound Iscs. The circle indicates the position of the positively charged residues involved in binding.

