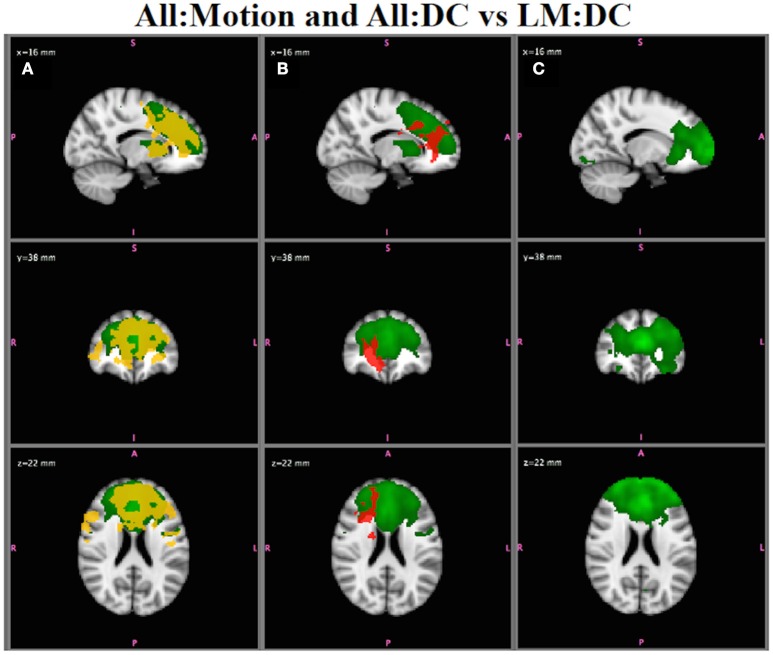
Figure 10.
In Vivo Results. (A) All:Motion analysis: the ECN (green) shows statistically significant differences in functional connectivity for high motion > low motion (red-yellow; p < 0.05). (B) All:DC analysis: the ECN shows group differences for SZ > HC (p < 0.05) in regions overlapping with the motion effects in (A). (C) Low Motion analysis: group differences in ECN between SZ and HC are no longer observed, even at very low statistical thresholds. Note that the IC map shown in A and B is from the All:GICA. The IC maps shown in C is from the LM:GICA.

