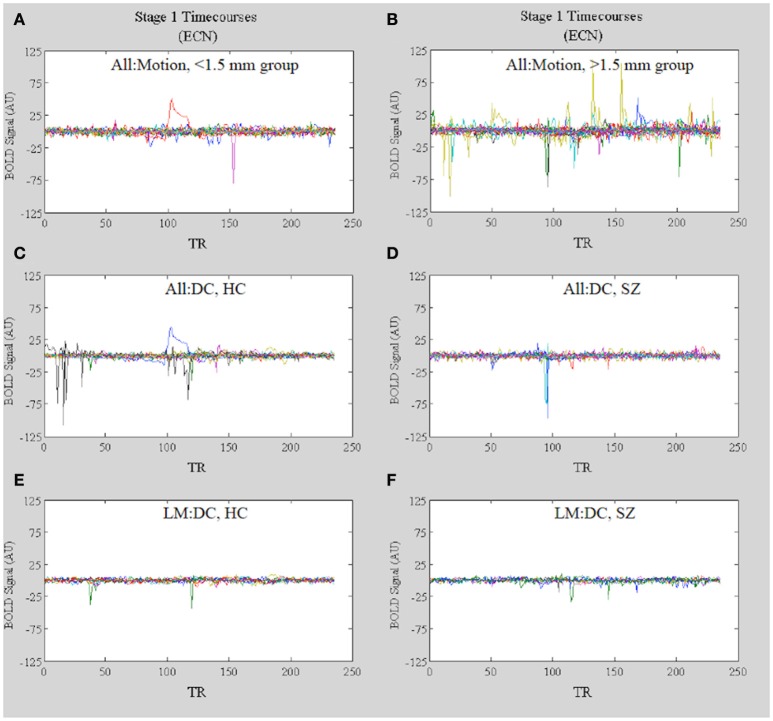
Figure 11.
In Vivo Results. Stage 1 timecourses for the ECN for: (A) All:Motion, lowest motion subjects (<1.5 mm) and (B) All:Motion, highest motion subjects (>1.5 mm); (C) HC included in the All:DC analysis and (D) SZ included in the All:DC analysis; (E) HC included in the LM:DC analysis and (F) SZ included in the LM:DC analysis. Note that the timecourses for the bipolar patients are included in B but not in (D) or (F).

