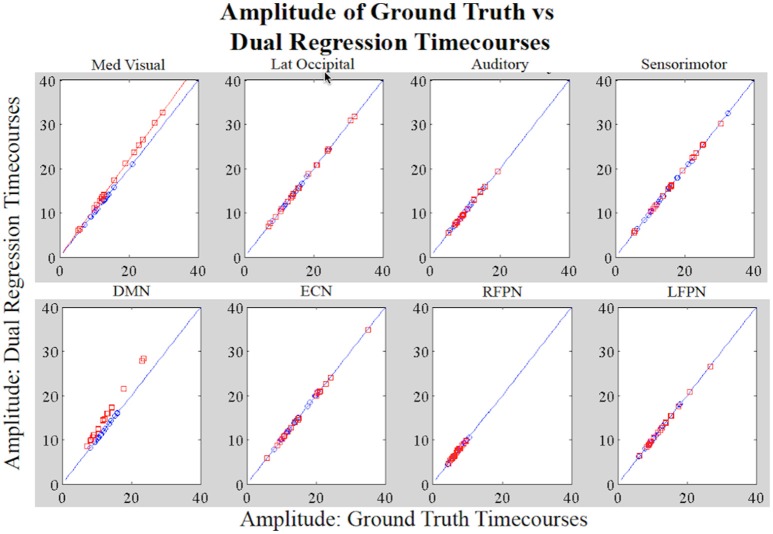
Figure 5.
Simulation Results. Each datapoint shown in the plots is the amplitude of the original RSN timecourse vs. the amplitude of the stage 1 timecourse for the subject assigned that timecourse (Group A: blue; Group B: red). For MVN, the network-wide amplitude difference between Groups A and B is reflected by the different slopes (Group A: y = x and Group B: y = 1.1*x; x = original timecourses). For the DMN, the within-network amplitude differences between groups are also reflected by datapoints in Group B not laying on the same line as those in A. All other networks show no group differences in amplitude.

