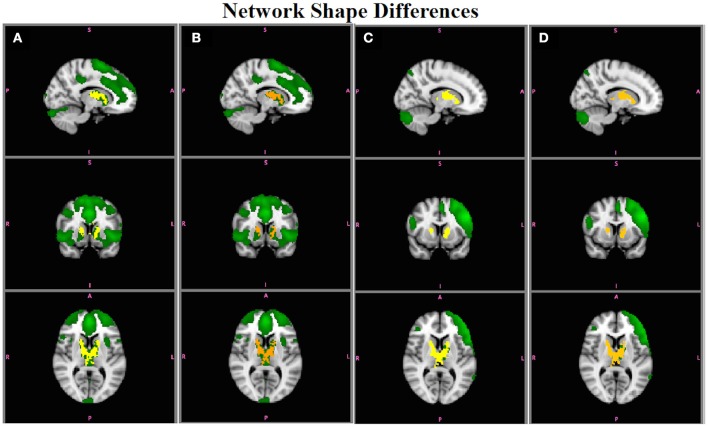
Figure 8.
Simulation Results. Group differences in the shape of the ECN obtained using (A) and (B) (red-yellow; A > B; p < 0.05), and in the LFPN using (C) and (D) (red-yellow; B > A). Both statistics accurately reflect the group difference in shape in ECN and LFPN in the absence of amplitude effects.

