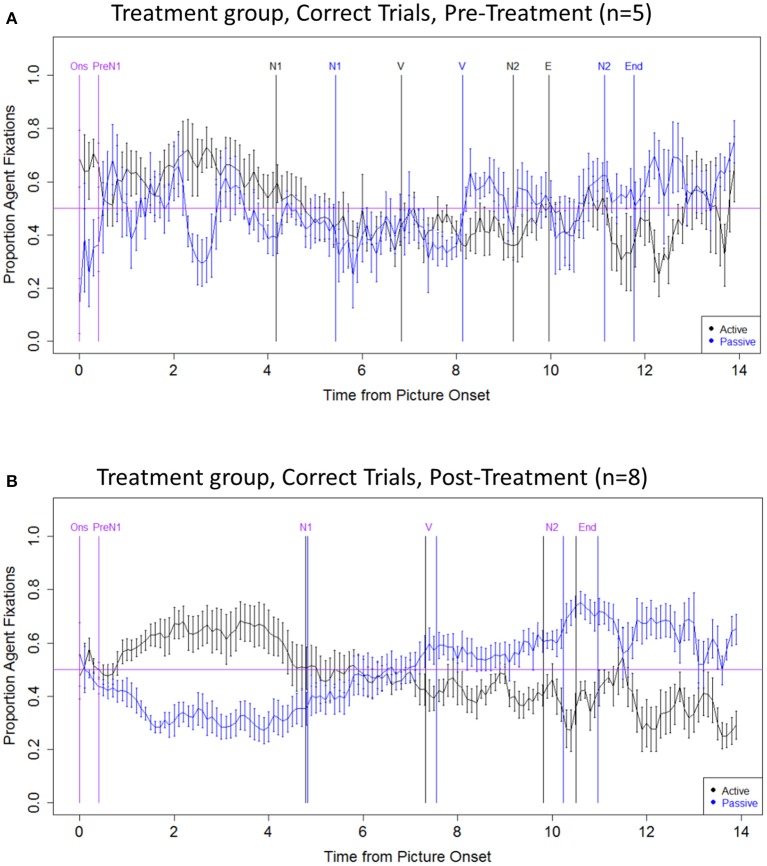
Figure 4.
Eye movement data: Treatment group, correct trials. (A) Pre-treatment data, (B) Post-treatment data. The x axis indicates the time from picture onset in seconds; the y axis indicates the proportion of fixations to the Agent, out of all fixations to the Agent and Theme. Vertical lines indicate the mean onset time for each sentence region (active in black; passive in blue; labels, and onset times that are the same/similar across structures, are in purple). The horizontal line indicates at-chance fixation patterns (i.e., an equal proportion of fixations to the Agent and Theme). Ons, picture onset; PreN1, beginning of PreN1 region (400 ms); N1, onset of subject noun; V, onset of verb; N2, onset of post-verbal noun; End, trial end.

