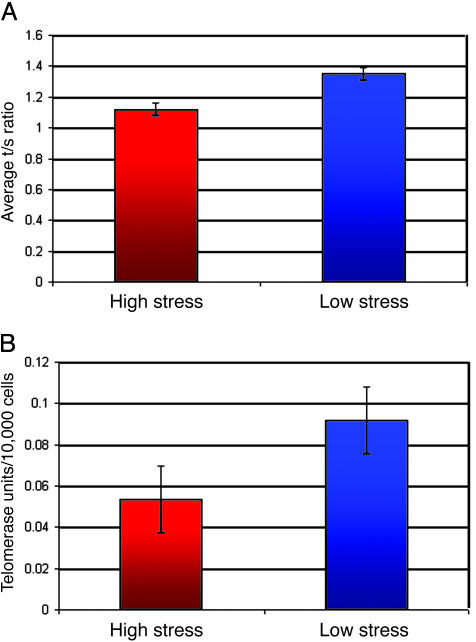
Fig. 2.
Telomere length and telomerase activity levels in extreme high- and low-stress groups. (A) Average telomere length and SE are shown. The high-stress group had shorter telomeres even after controlling for age and BMI [F(1, 27) = 12.8, P < 0.001]. (B) Average telomerase activity and SE are shown. The high-stress group had lower telomerase activity even after controlling for age and BMI [F(1, 27) = 3.1, P < 0.05]. Because values for telomerase activity were not normally distributed, the values were converted to follow a normal distribution by using a natural logarithm transformation. All statistical analyses were performed on the transformed variable. The raw (unadjusted) levels of telomerase are presented throughout because these values are more meaningful than transformed values.

