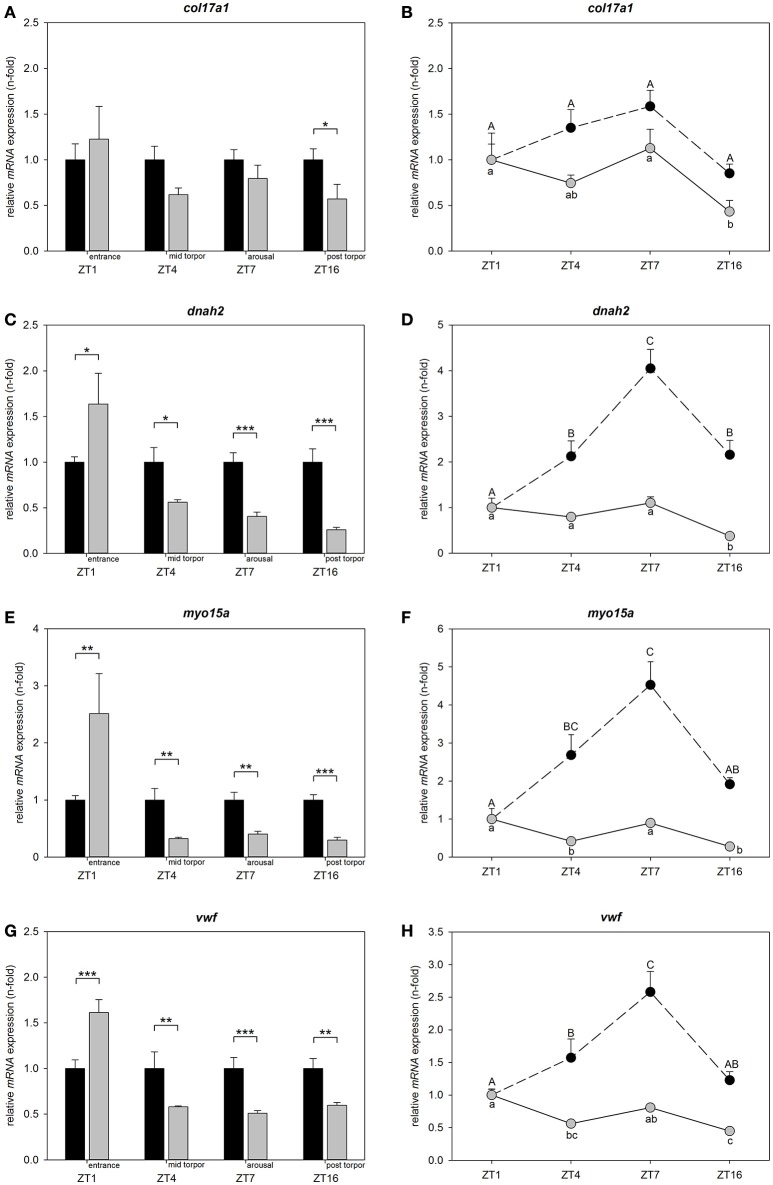
Figure 4.
Circadian regulation of col17a1, dnah2, myo15a, and vwf in torpid and normothermic Djungarian hamsters. Bar graphs on the left side show differences in mRNA expression of col17a1 (A), dnah2 (C), myo15a (E), and vwf (G) in torpid animals (gray bars, ±SEM) relative to normothermic control group at same ZT (black bars, ±SEM). Significant differences are marked with *p < 0.05, **p < 0.01, and ***p < 0.001. Line graphs on the right side show relative differences in mRNA expression of col17a1 (B), dnah2 (D), myo15a (F), and vwf (H) over the course of a day within normothermic animals relative to normothermic ZT1 group marked with upper case (black circles, ±SEM) and within torpid animals relative to torpid ZT1 group marked with lower case (gray circles, ±SEM). Data points with different characters are significantly different (p < 0.05).

