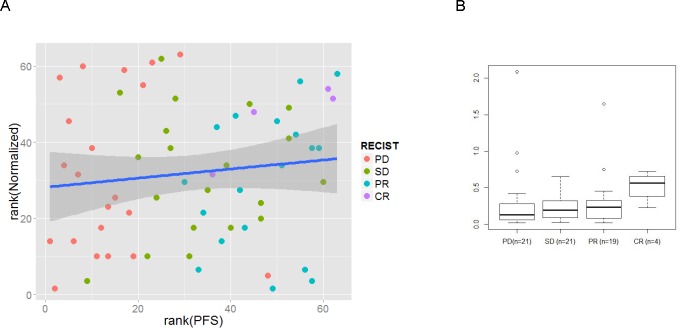
Figure 5. RTqPCR results for the miR-99b-5p expression analysis (n=61).
Mean value of three control RNAs (RNU44, RNU 48 and U6 snRNA) has been used as reference for normalization of miRs expression levels. A: The Spearman's rank correlation analysis of progression free survival (PFS, X=axis) and the miR-99b-5p expression (Y axis) resulted in 0.21 (p=0.10), that indicate low statisticaly insignificant correlation, in contrast to high correlation observed for miR sequencing data. B: the analysis of RECIST classes and its correlation with miR-99b-5p expression. No statistically significant correlation observed (two tailed student's t-test).

