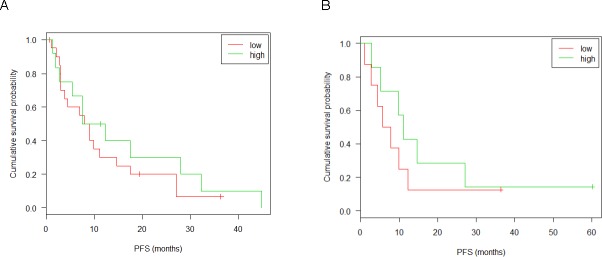
Figure 8. Kaplan-Meyer plots and survival analysis for miR-99b-5p in the confirmation group.
Discovery group: patients from UHZ, Vienna or Tübingen that were not sequenced. (A) RTqPCR of tumor tissue: split point 0.18; sample size 20(low), 12(high); p-value 0.457; 95% confidence interval [0.3; 1.6]. (B) RTqPCR of serum from 15 patients of the Tübingen cohort: split point 0.11; sample size 8(low), 7(high); p-value 0.401; 95% confidence interval [0.2; 1.9]. Censored observations are marked by crosses. Results of the likelyhood ratio test are given in the inset. Patents were distributed into low and high expressor groups according to a log-rank test.

