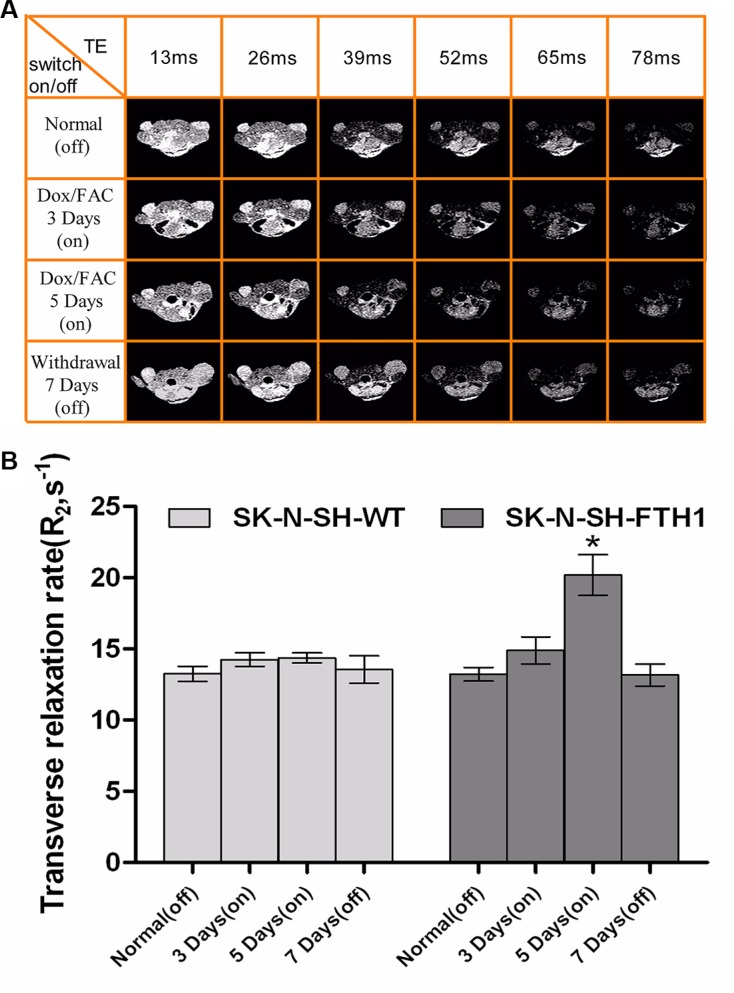
Figure 8. In vivo MRI results of a cell graft with (“on”) and without (“off”) induced FTH1 expression.
(A) A multi-echo MRI sequence of a single mouse that completed the longitudinal series of MRI scans, showing remarkable contrast between the SK-N-SH-FTH1 (left hind limb, corresponding to the right side of the images) and SK-N-SH-WT (right hind limb, corresponding to the left side of the images) cell grafts in the tumor-bearing nude mice when FTH1 was induced (“on”) by 2 mg/ml Dox and 5 mg/ml FAC for 5 days while no contrast was observed when FTH1 was not induced (“off”). When Dox was withdrawn for 7 days, the signal intensity was similar for both cell graft types. (B) The R2 values of SK-N-SH-FTH1 cell grafts treated with 2 mg/ml Dox and 5 mg/ml FAC for 5 days (5 days “on”) was higher than those found for other conditions (“off”, 3 days “on” and 7 days “off”). For SK-N-SH-WT cell grafts, there were no differences in the R2 values among the four conditions (normal “off”, 3 days “on” 5 days “on”, and 7 days “off”).

