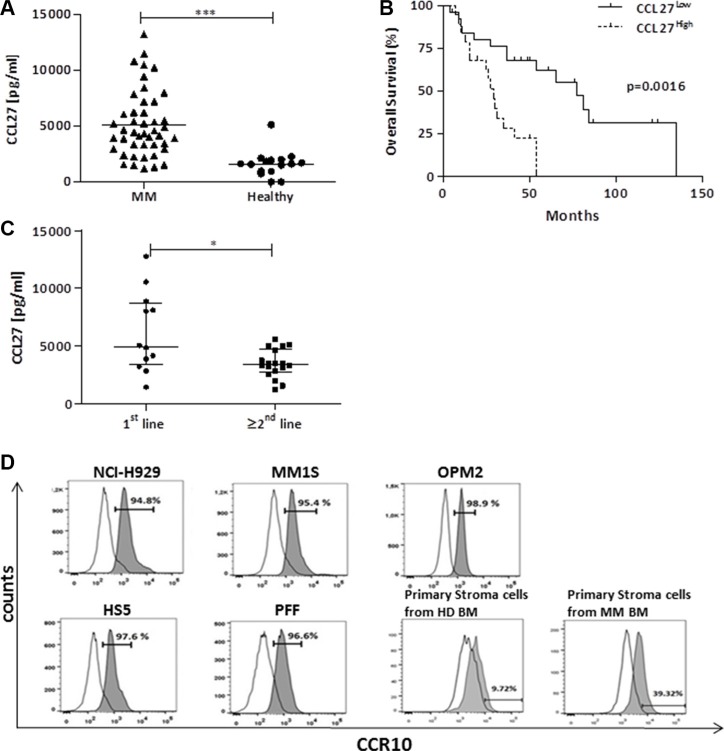
Figure 1. High bone marrow CCL27 levels correlate with poor survival and primary refractory disease and stromal CCR10 expression might facilitate signaling.
(A) Plasma samples from bone marrow aspirates of myeloma patients and healthy, age-matched donors (collected at Innsbruck Hospital) were analyzed for CCL27 by Elisa. Values are in pg/ml, ***p < 0.001. (B) Kaplan-Meier survival curves for patients expressing CCL27 at high and low levels, respectively (cutoff determined by ROC analysis). (C) Bone marrow plasma samples from patients refractory to bortezomib at first line treatment versus later lines were collected at diagnosis at Brno Hospital and further analyzed by Elisa as above. Boxplots show median and interquartile range. *p < 0.05; (D) Histograms of CCR10 expression on myeloma cell lines (NCI-H929, MM.1S, OPM-2), stroma cell line HS-5, primary fibroblasts (PFF), primary stroma cells isolated from a healthy donor (HD) and a diseased bone marrow (MM), percentage of positive cells is depicted. Open histogram: isotype control, solid histogram: specific CCR10 staining.

