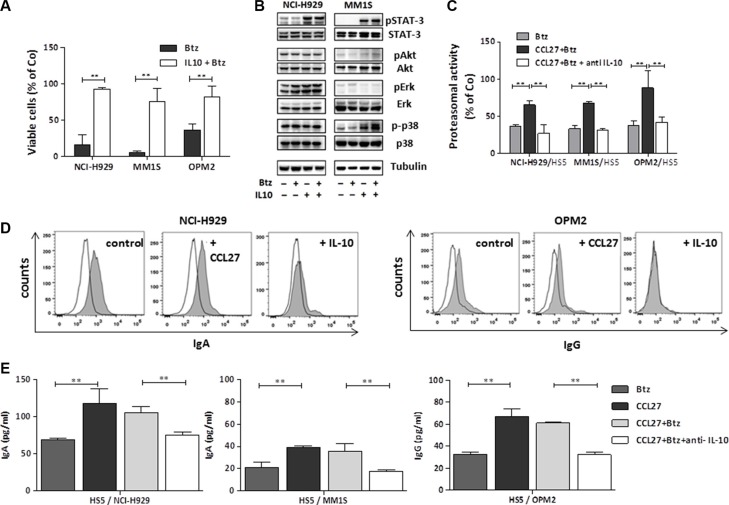
Figure 6. Impact of IL-10 on myeloma cell survival, signalling, proteasomal activity and presentation of surface immunoglobulins.
(A) Myeloma cells (1 × 10⁵ cells/well) were treated with 5.2 nM bortezomib with/without the addition of 5.5 nM IL-10 and cell viability was measured after 48 hrs. Mean percentage of viable cells (of control) +/− SD of 3 independent experiments is shown. **p < 0.01; (B) Cell lysates from myeloma cells (1 × 10⁶ cells) treated as indicated for 3 hrs (bortezomib 5.2 nM, IL-10 5.5 nM) were analysed by Western blot for the quoted proteins. Representative blots for NCI-H929 and MM.1S cell line, respectively, are shown. Tubulin is used as loading control. Quantification of band intensities is summarized in Supplemental Table 1. (C) Proteasomal activity in cocultured myeloma cells (ratio 2:1) treated for 30 minutes as indicated (bortezomib 5.2 nM, CCL27, 7.9 nM, anti-IL-10 2 μg/well) was measured using Proteasome-Glo™ Cell-Based Assays and is shown as percentage activity of untreated cells (n = 3, **p < 0.01). (D) Surface immunoglobulin expression after 24 hrs incubation with 7.9 nM CCL27 or 5.5 nM IL-10 was measured by FACS. Histograms show one representative analysis out of three per cell line. Open histogram: isotype, solid histogram: specific staining. (E) Secreted Immunoglobulin levels (IgA and IgG) in the supernatant of coculture experiments treated as indicated (bortezomib 5.2 nM, anti-IL-10 2 μg/well) for 24 hrs were measured by Elisa and results are shown as mean pg/ml +/− SD (n = 3, **p < 0.01).

