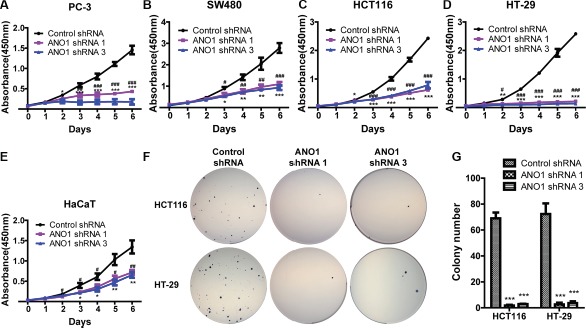
Figure 2. Silencing ANO1 inhibits cell proliferation.

(A–E) Cell proliferation of the indicated cell lines was assessed by CCK8 assay. Three days after lentiviral infection of ANO1 shRNAs, cells were re-plated into 96-well plates and cell proliferation was measured every day for six days. Silencing ANO1 resulted in significant inhibition of cell viability in a time-dependent manner. Data are expressed as mean ± SEM; n = 4; #P < 0.05, ##P < 0.01 and ###P < 0.001 are for statistical comparisons of ANO1 shRNA 1 versus control shRNA; *P < 0.05, ** P < 0.01 and *** P < 0.001 are for statistical comparisons of ANO1 shRNA 3 versus control shRNA. (F) Representative images of colony formation in soft agar assay. Knockdown of ANO1 by ANO1 shRNA1 or shRNA3 decreased the colony-formation capacity of HCT116 and HT-29 as compared with control shRNA. (G) Quantitative analysis of colony numbers from F. Data are expressed as mean ± SEM; n = 3; ***P < 0.001.
