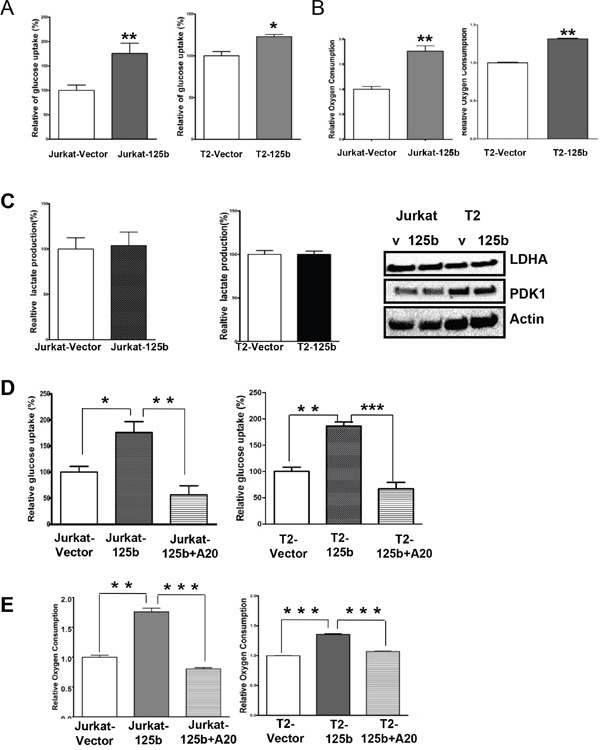
Figure 5. miR-125b regulates the glucose metabolism in T cells via A20.

A and D. Cells were cultured in medium containing 10% fetal bovine serum (FBS) and glucose uptake was measured. Data are showing percentage relative to Jurkat –vector (left) or T2 vector (right). B and E. Oxygen consumption rates of Jurakt-vector, Jurkat-miR-125b, Jurkat-miR-125b transfected with A20 (left), T2-vector and T2-miR-125b Jurkat-miR-125b transfected with A20 cells (right) were measured. The oxygen consumption rate was calculated on the basis of the maximal rate of change in relative fluorescence units (DFU/second). Columns, mean of three independent experiments C. Cells were cultured in medium containing10%FBS and lactate production in the medium was measured as described in Materials and methods. Data are showing percentage. Jurkat-vector, Jurkat-A20, T2-vector and T2 –miR-125b stable cell lines were collected. Cell lysates were prepared for Western blotting with antibodies against PDK1 and LDHA. β-actin was used as a loading control.
