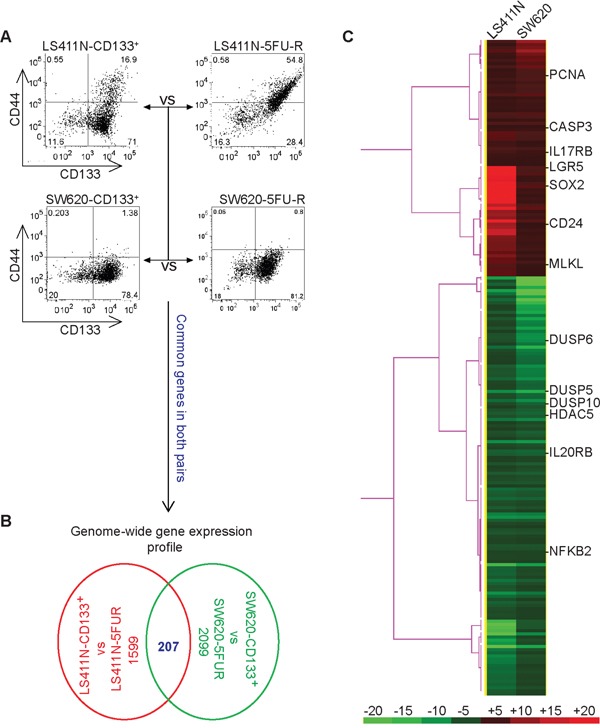
Figure 4. Genome-wide gene expression profiles of colon cancer stem-like cells.

A. Scheme of genome-wide gene expression analysis. LS411N-CD133+ cells were compared to LS411N-5FU-R cells and SW620-CD133+ cells were compared to SW620-5FU-R cells by DNA microarray analysis. Shown are phenotypes of the two pairs of cells. B. Analysis of the differentially expressed genes between CD133+ cells and 5-FU-R cells. Genes whose expression levels are changed by at least 2 fold (either up-regulated or down-regulated) were selected. The ratios are LS411N-CD133+/LS411N-5FUR and SW620-CD133+/SW620-5FU-R. The number of differentially expressed genes of each pair and the commonly differentially expressed genes of the two pairs of cells are shown. C. The commonly differentially expressed genes in two pairs of cells as shown in A and B (n=207) was selected. Cluster 3.0 program was used to analyze the gene expression patterns in a one-dimensional hierarchical clustering to generate gene dendrograms based on the pair-wise calculation of the Pearson coefficient of normalized fluorescence ratios as measurements of similarity and linkage clustering. The clustered data were loaded into TreeView program and displayed by the graded color scheme. Genes that have known functions in stem cell maintenance (CD24, LGR5, and SOX2), cell proliferation, and death (PCNA, CASP3, MLKL, DUSP5, DUSP6, NFKB2, and HDAC5), and for immune response (IL17RB and IL20RB) are indicated. Red columns indicate genes whose expression level is higher in LS411N-CD133+ and SW620-CD133+ cells as compared to LS411N-5FU-R and SW620-5FU-R cells, respectively. Green columns indicate genes whose expression level is higher in LS411N-5FU-R and SW620-5FU-R cells as compared to LS411N-CD133+ and SW620-CD133+ cells, respectively. The color bar at the bottom panel represents the level of differential expression. The number above the bar indicates the fold changes.
