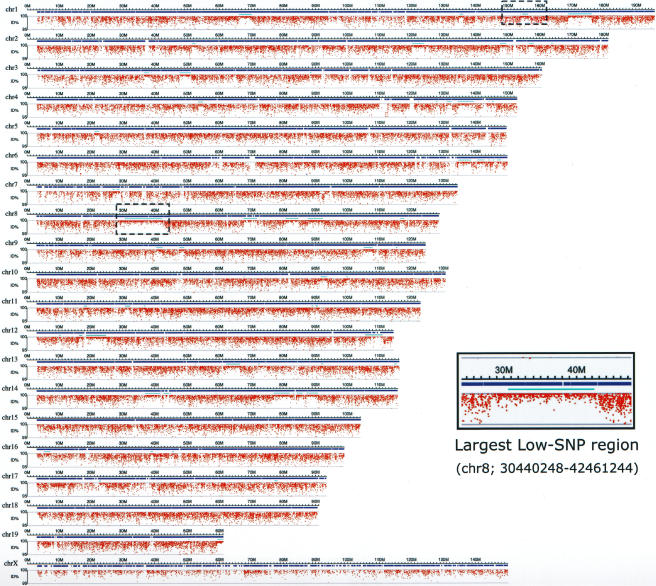
Figure 3.
Distribution of SNPs across the chromosomes; identification of low- and high-SNP regions. The percentage identity of each of the MSM BESs in comparison with the B6 sequences was plotted along the chromosomes. Red dots represent the MSM BESs, and positions of the dots along the y-axis indicate % identity of each BES. Examples of the low-SNP regions (chr8; 30440248–42461244) are enlarged and shown in the inset. Position of this enlarged region on chromosome 8 is indicated by a dashed rectangle. Another dashed rectangle on chromosome 1 indicates position of a BAC clone, MSMg01-122K03, which was completely sequenced (see Fig. 4). Horizontal bars represent chromosomes, and chromosome number is indicated at left side. Blue bars represent genomic regions covered by the MSM BAC clones. Light blue bars indicate the low-SNP regions.

