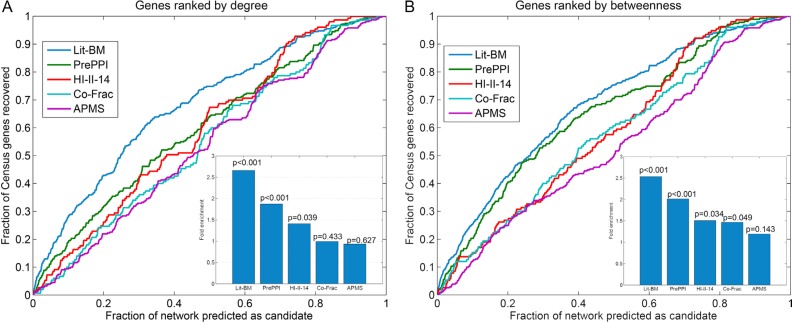
Figure 1. Comparative analysis of different interactome datasets for prioritizing cancer genes.
(A) The recall rate of different interactome datasets based on degree. (B) The recall rate of different interactome datasets based on betweenness. The figures on the bottom right are fold enrichment of each network at the cutoff of 10%. P-values are computed based on the frequencies of occurrence in randomized networks.

