
Figure 2. AntimiR-218-5p treatment reduces tumor growth and protects from breast cancer-induced osteolytic disease.
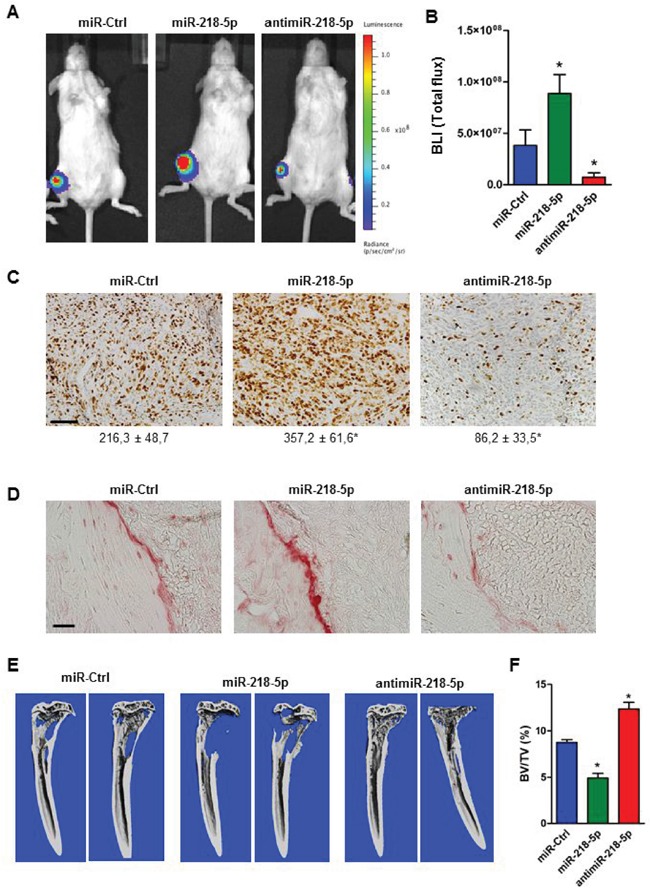
A. MDA-MB-231 cells stably expressing luciferase were transfected with the indicated oligonucleotide and transplanted into the tibiae of immunocompromised mice. Tumor growth was visualized after four weeks by bioluminescence imaging. B. Quantification of bioluminescence intensity (BLI) using Living Image software. N= 6 mice/ group. Mean values ± SEM, * p<0.05 vs. miR-Ctrl. C. Actively proliferating cancer cells were stained with Ki-67 and quantified with the Osteomeasure System. Scale bar indicates 50 μm. Number of Ki-67-positive cells/ field is indicated below each representative image. N= 6 mice/ group. Mean values ± SEM, * p<0.05 vs. miR-Ctrl. D. Presence of active osteoclasts in tumor bearing bones following miR-218-5p deregulation was visualized by TRAP staining. Scale bar indicates 50 μm. E. Osteolytic lesions were determined by μCT imaging and F. analysis of bone mass. BV/TV; bone volume/tissue volume. N= 6 mice/ group. Mean values ± SEM, * p<0.05 vs. miR-Ctrl.