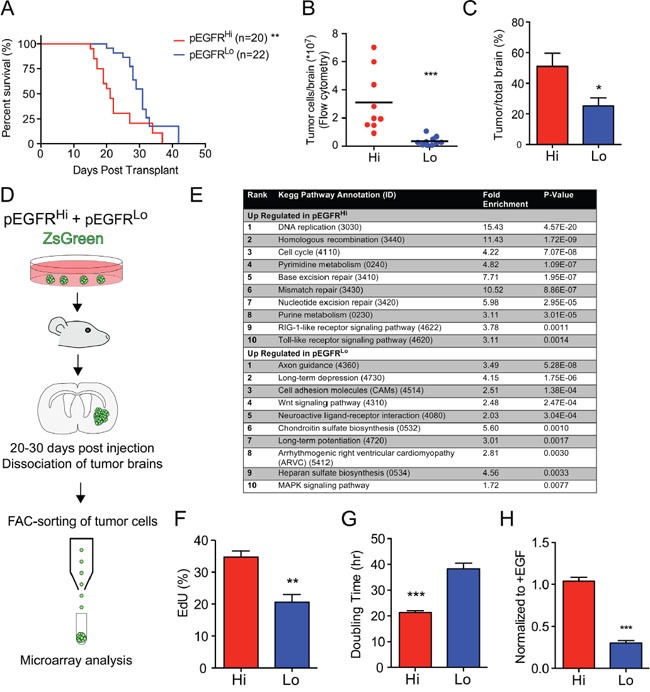
Figure 2. EGFRvIII activity associated with more aggressive tumors and gene expression signature.

A. Kaplan-Meier survival curve comparing survival of mice transplanted with pEGFRHi and pEGFRLo tumor cells. Log-rank test median survival 21 versus 31 days, respectively (p<0.0001) B. Total number of ZsGreen-tagged tumor cells per brain enumerated by fluorescence-activated cell sorting (FACS). C. Area of brain involved by tumor as a percentage of total brain area per section with the greatest tumor. D. Schematic of isolation of tumor cells by FACS for microarray analysis. E. Enrichment of KEGG pathway processes in pEGFRHi versus pEGFRLo tumors based on in vivo microarray analysis of gene expression in sorted cells. F. In vitro EdU incorporation in pEGFRHi and pEGFRLo following a 2-hour pulse. G. In vitro doubling time of pEGFRHi (Hi) and pEGFRLo (Lo) cells. H. Growth of pEGFRHi (Hi) and pEGFRLo (Lo) cells in the absence of added EGF ligand relative to growth in EGF-supplemented controls. p<0.05 = *, p<0.01 = **, p<0.001 = ***. Error bars are displayed as standard error of mean (SEM). (C) n=4.; (F and H) n=3; (G) pEGFRHi n=54, pEGFRLo n=37.
