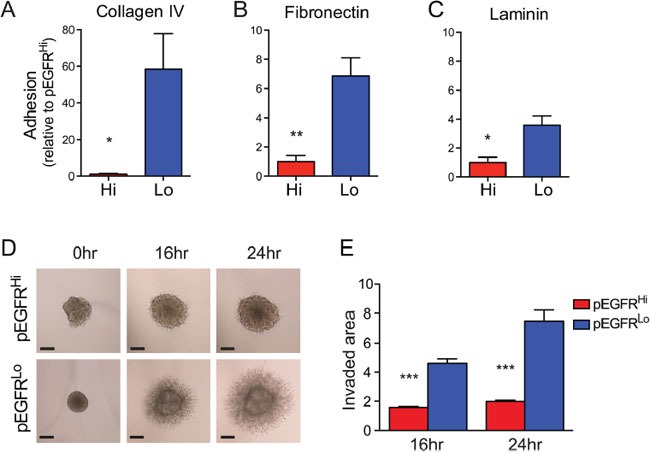
Figure 6. EGFRvIII highly active tumor cells exhibit decreased cell adhesion and invasion in vitro.

A-C. Adhesion of pEGFRHi and pEGFRLo cells to collagen IV (A), fibronectin (B), and laminin (C), matrices, expressed as fold-change relative to pEGFRHi. D. Representative images of matrigel 3D spheroid invasion assay and quantification of pEGFRHi and pEGFRLo invasion E. at 16hr and 24hr normalized to pEGFRHi at 0 hours. Scale bars: A=50 μm. p<0.05 = *, p<0.01 = **, p<0.001 = ***. Error bars are displayed as standard error of mean (SEM). (A) n=4, (B and C) n=3, (E) n=4.
