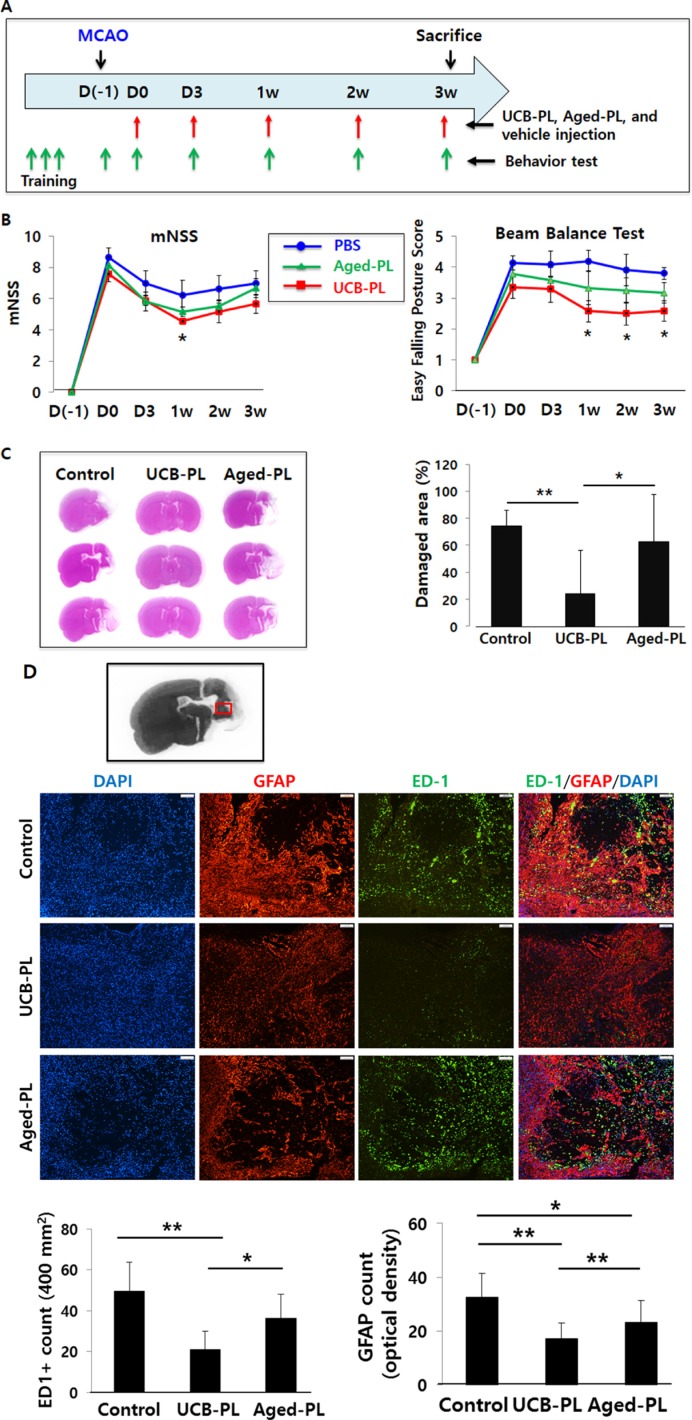
Figure 6. Comparison of therapeutic effects among the UCB-PL, aged-PL, and control groups.
(A) Schedule of the experiment. (B) The behavioral performances of rats in each group were measured with using the modified neurologic severity score (mNSS) (left) and the beam balance test (right). (C) The percentage of damaged area per hemisphere was measured 3 weeks after the MCAO surgery. (D) The expression levels of ED1 and GFAP were measured in the peri-infarct striatum and compared among the 3 groups. The number of ED1-positive cells (right andupper graphs) and GFAP-positive optical density (right and lower graphs) were measured in the peri-infarct area. n = 5 for the control group, n = 6 for the aged-PL group, and n = 6 for the UCB-PL group. **p < 0.01, *p < 0.05; data are presented as the mean ± SEM.

