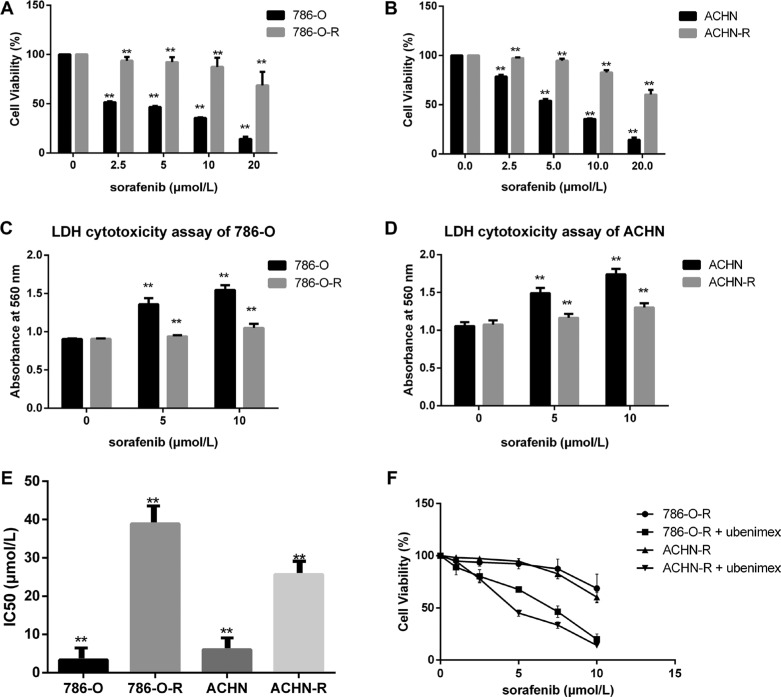
Figure 1. Sorafenib resistant cells show lower susceptibility.
(A, B) Sorafenib resistant cells had higher cell viability. (C, D) To estimate the extent of cell death, LDH cytotoxicity assay was used, with absorbance measured at 560 nm. In the first sorafenib treatment, cell lines showed overt growth inhibition and increased cell death. (F) Ubenimex inhibited resistant cells. Data represent three independent experiments. **P < 0.001 versus sorafenib sensitive cells.(E):Sorafenib-resistant cells showed higher IC50 values for sorafenib compared with parental cells (*P < 0.05 vs parental cells).

