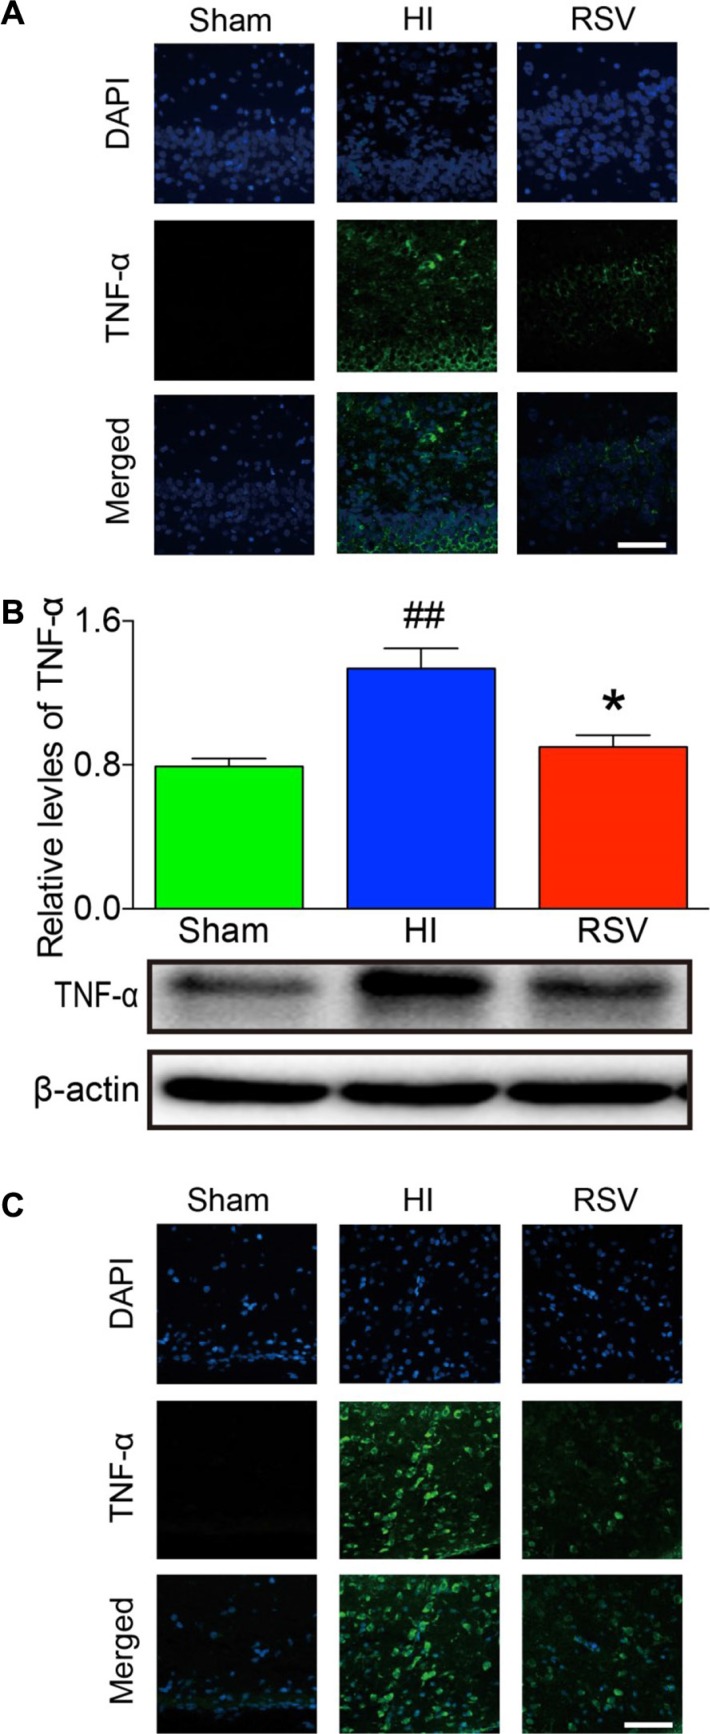
Figure 6. TNF-α immunohistochemistry and Western blots.
Representative examples of microphotographs from 7 days after hypoxic-ischemia in the hippocampal dentate gyrus (A) and cortex (C). (B) Western blot analysis of TNF-α levels in the hippocampus. β-Actin served as a protein loading control. The protein TNF-α contents were significantly lower in hippocampus of the RSV animals 7 days after hypoxic-ischemia than the HI animals (upper panel B). Representative Western blot detected with anti-TNF-α antibody (lower panel B). Scale = 100 μm. Values are mean ± SEM, n = 5 rats per group. RSV vs. HI, *p < 0.05; Sham vs. HI, ##p < 0.01.

