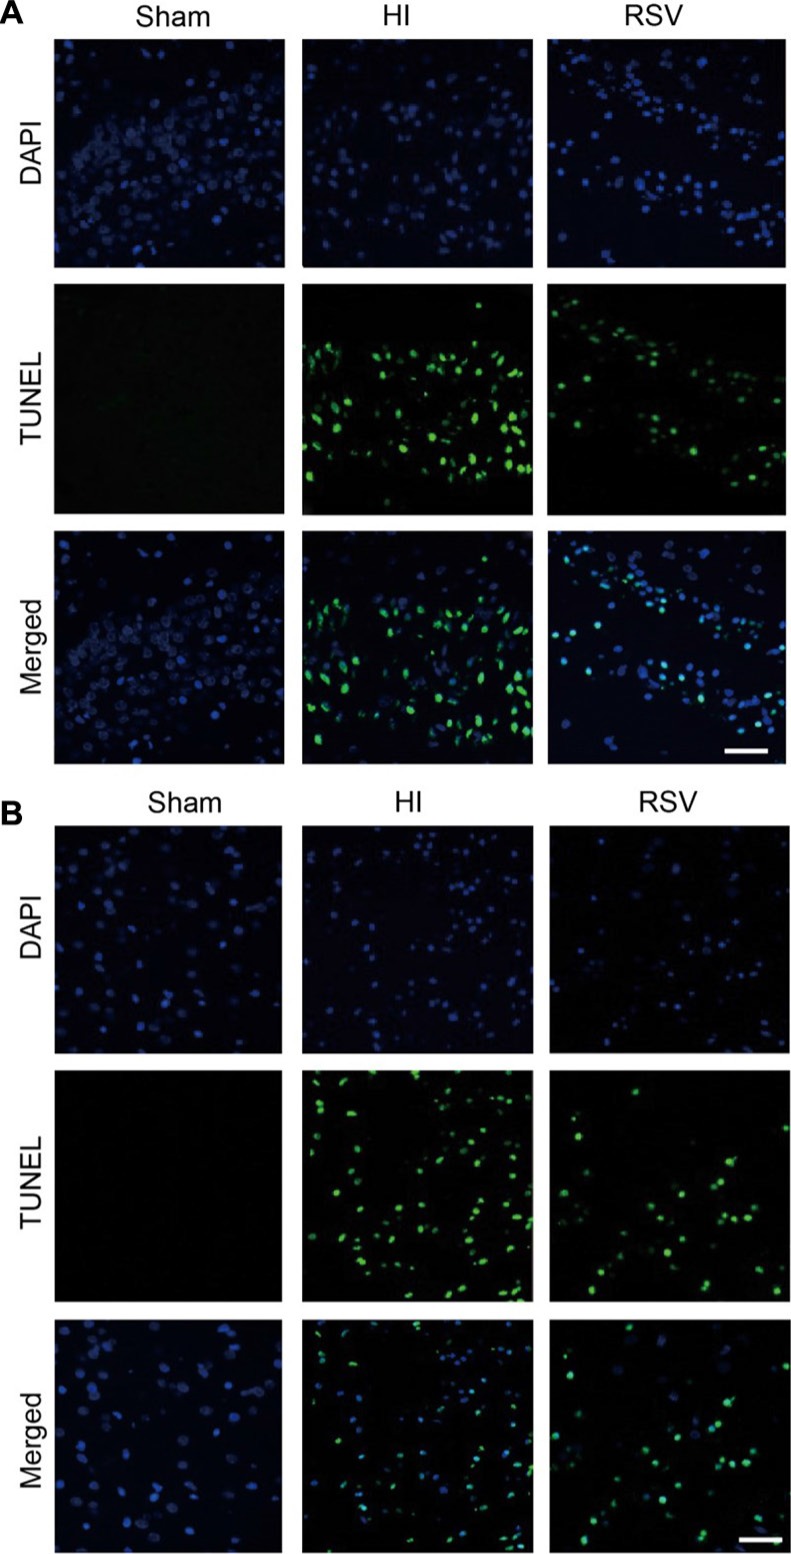
Figure 8. TUNEL immunohistochemistry.
Representative examples of microphotographs from 7 day after hypoxic-ischemia in the hippocampal dentate gyrus (A) and cortex (B). Note that the TUNEL immunoreactive signals were significantly increased in the HI group versus the Sham, and decreased after post-treatment with RSV. Scale = 100 μm.

