
Figure 3. Schematic illustration of increasing engraftment rates (A, the white bars represent the total number of implanted mice per each passage while the grey area depicts the effective take on rates).
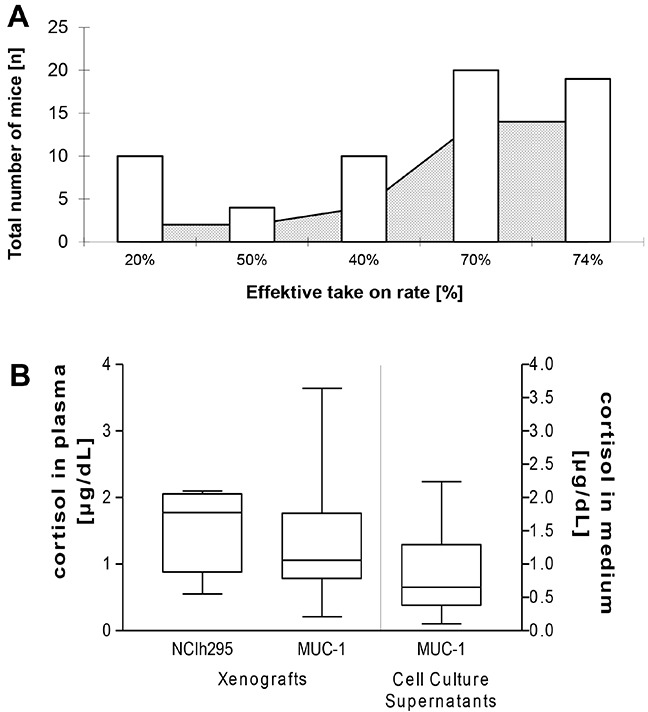
Cortisol measurements of plasma from NCI-H295R (n=6) and MUC-1 (n=17) tumor-bearing mice in vivo and of cell culture supernatants (n=14 of passages 3, 4, 5, 6, 8, 9, 10, 12 and 15 which were offset against a medium blank in triplicate) of MUC-1 cells in vitro B.