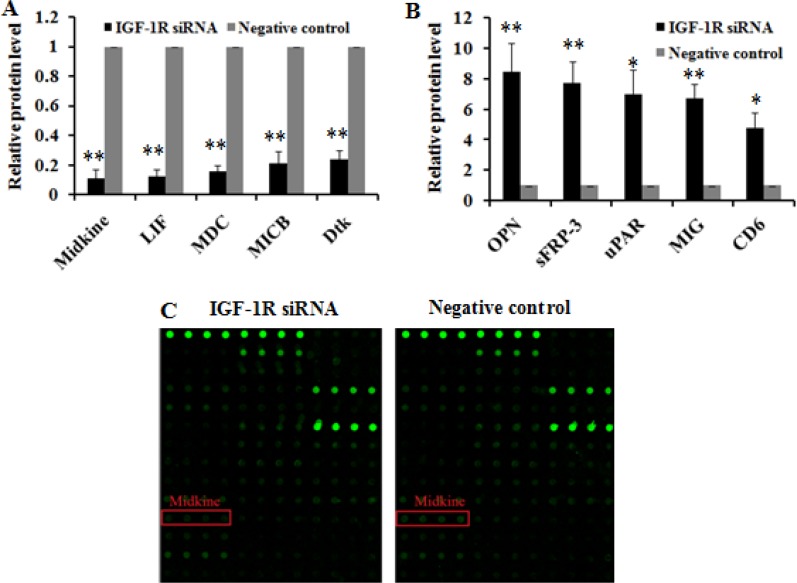
Figure 8. The top 10 cytokines differentially expressed due to IGF-1R knockdown by RNAi in Huh7 cells.
The top 5 cytokines that were down-regulated (A) or up-regulated (B) in Huh7 cells with IGF-1R knockdown were presented compared with negative control. (C) Imaging of midkine protein array analysis in Huh7 cells. The scanning signal was weaker in Huh7 cells with IGF-1R knockdown compared with negative control (P = 0.000). *P < 0.05, **P < 0.01 versus negative control group.

