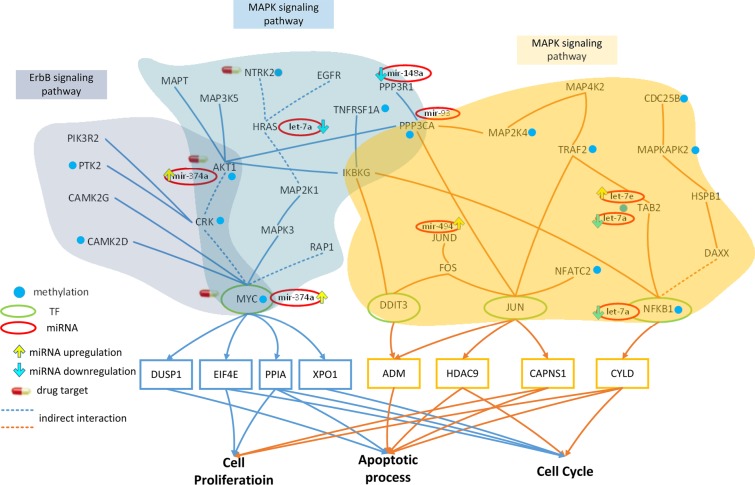
Figure 3. Effect of miRNA regulation and DNA methylation on the mechanism of progression of HCC from stage I to stage II.
The blue frames and lines represent stage I HCC, while the yellow frames and lines represent stage II HCC. Blue nodes represent DNA methylation. The green and red ovals represent transcription factors (TFs) and miRNAs, respectively. The upward yellow arrowhead represents miRNA upregulation during stage II HCC, compared to that in stage I. The downward blue arrowhead represents miRNA downregulation in stage II compared to that in stage I. AKT1, RTK2, HRAS, CAMK2G, CAMK2D, PI3KR2, CRK, and MYC are involved in the ErbB signaling pathway and AKT1, TNFRSF1A, HRAS, MAP3K5, MAPT, IKBKG, NTRK2, PPP3R1, RAP1A, PPP3CA, CRK, and MYC are involved in the MAPK signaling pathway during HCC stage I. The transcription factor MYC is activated by a number of stress signals, including the ErbB pathway and MAPK signaling pathway, which induce various cellular responses, including cell proliferation, apoptosis, and cell cycle. TRAF2, MAP2K4, MAP4K2, NFKB1, MAPKAPK2, DAXX, TAB2, DIT3, CDC25B, FOS, JUN, JUND, IKBKG, HSPB1, PPP3CA, and NFATC2 regulate the MAPK signaling pathway during HCC stage II. The transcription factors DDIT3, JUN, and NFKB1 are activated by a number of stress signals including the MAPK signaling pathway, which induces cell proliferation, apoptosis, and cell cycle. miRNA and DNA methylation induced dysregulation may contribute to the perturbation of the MAPK and ErbB pathway, resulting in aberrant cellular responses and HCC progression from stage I to stage II. Obviously, the shift from the ErbB pathway to the MAPK pathway, owing to the differences in epigenetic miRNA regulation and methylation could be responsible for disease progression. In this study, NTRK2, CDC25B, and HRAS were selected as potential drug targets to prevent the progression of HCC from stage I to stage II.

