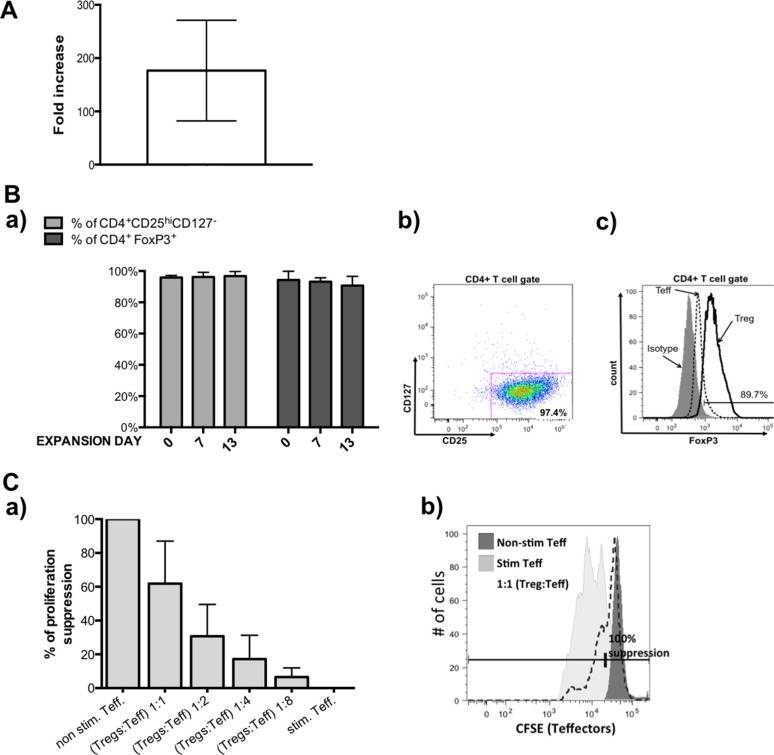
Figure 1. Results from pre-clinical grade Treg expansions.
(A) Fold increase in Treg cell number achieved during pre-validation expansions. (B) Treg phenotype during expansion, a) % of CD4+CD25hiCD127lo/−(light gray bars) and % CD4+FoxP3+ (dark gray bars) within expanded Tregs was maintained on high level, b) representative flow cytometric dot plot showing frequency of CD4+CD25hiCD127lo/− cells in analyzed sample of Tregs, c) representative flow cytometric histogram overlay showing analysis of FoxP3 expression in sample of Tregs (black line), expanded on the same time Teffectors that served as the control (dotted line) and isotype (on gray) based on which gate was placed. (C) Suppressive abilities of expanded Tregs in in vitro assay. (a) Expanded Tregs indicated good suppressive abilities, (b) representative of flow cytometric histogram showing CFSE signal of stained Teffectors; non-stimulated with anti-CD3/CD28 beads Teffectors (dark gray) served as control for 100% suppression of proliferation and % of suppression in conditions with Tregs were calculated using following formula: (% of suppressed cells in Teff. co-cultured with Tregs × 100) / % of suppressed cells in non-stimulated Teff. Results throughout the figure are expressed as mean ± SD; n ≥ 3.

