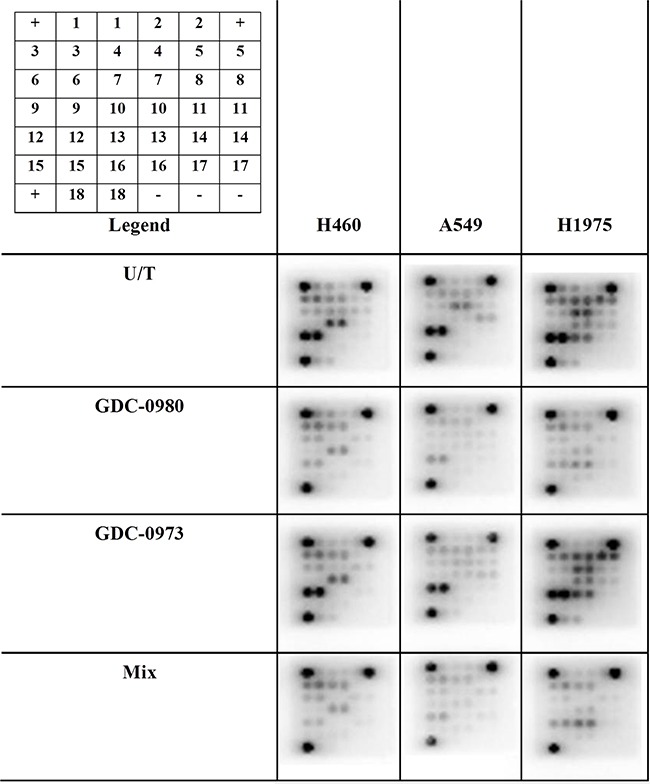
Figure 10. The effects of co-targeting PI3K-mTOR and MEK on phosphoprotein expression in a panel of three NSCLC cell lines.

Protein was isolated from H460, A549 and H1975 cell lines at baseline and after treatment with GDC-0980 (1μM, 4hrs), GDC-0973 (2μM, 6hrs) and a mix of the 2 drugs using Cell Signalling lysis buffer. Intracellular signalling protein expression was explored using PathScan arrays (duplicate spots, n=3). Array images are shown with postive (+) and negative (−) controls identified. 1: ERK1/2 (Thr202/Tyr204), 2:Stat1(Tyr701), 3: Stat3 (Tyr705), 4: AKT (Thr308), 5: AKT (Ser473), 6: AMPKα (Thr172), 7: S6RP (Ser235/236), 8: mTOR (Ser2448), 9: HSP27 (Ser78), 10: BAD (Ser15), 11: p70S6K (Thr389), 12: PRAS40 (Thr246), 13: p53 (Ser15), 14: p38 (Thr180/Tyr182), 15: SAPK/JNK (Thr183/Tyr185), 16: PARP (Asp214), 17: Caspase-3 (Asp175), 18: GSK-3β (Ser9).
