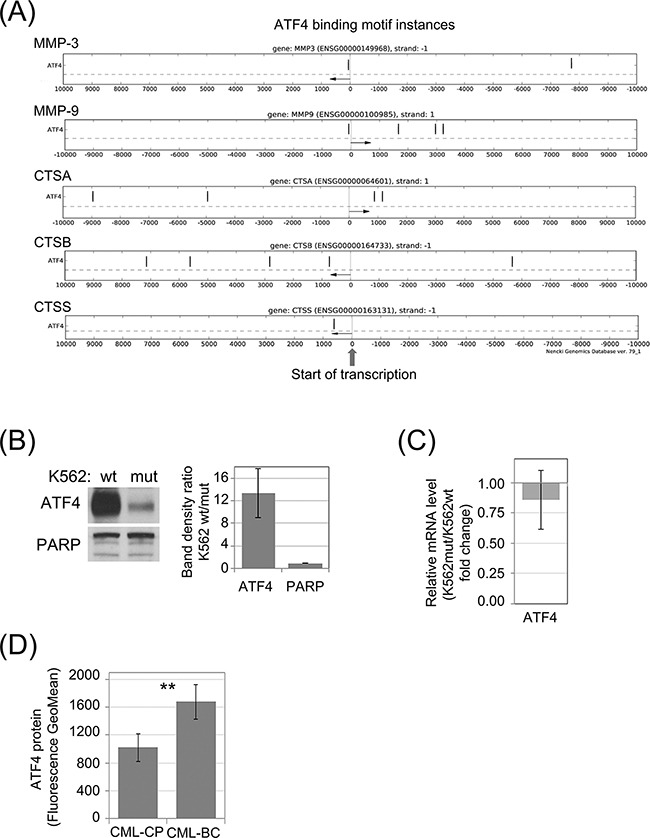
Figure 4. Synthesis of ATF4 protein in leukemia cells is dependent of eIF2α phosphorylation.

A. Genomic locations of potential ATF4 binding motifs (black vertical dashes) in experimentally verified gene regulatory regions within 10kb from transcription start sites (TSS) of selected protease genes. Distance from the TSS is indicated on the X-axis. Direction of transcription is marked with an arrow. B. Protein level of ATF4 in K562wt and K562mut cells analyzed by immunoblot; PARP was used as loading control. Band density was quantified and expressed as mean ratio in K562wt to K562mut cells ± SEM; n=3 C. Level of ATF4 mRNA was determined by real-time RT-PCR, and is shown as fold change of K562mut to K562wt cells. D. Level of ATF4 protein in Lin-CD34+ primary cells from CML-CP and CML-BC was analyzed by flow cytometry. Fluorescence GeoMean values of CML-BC to CML-CP ± SEM; n=3 independent samples. **p<0.005 in Student's t-test.
