
Figure 3. Bioinformatic analysis of different expression genes after overexpressing GPC5 in A549 cell lines.
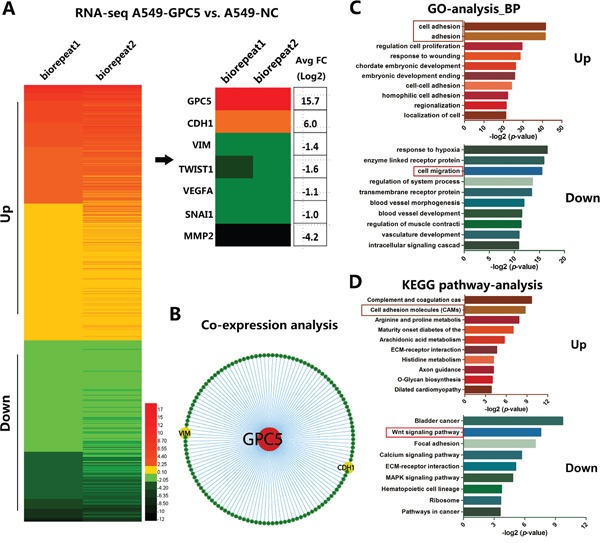
A. Heat map diagrammed up and down regulated genes in OE-GPC5 A549 cells. B. E-cadherin (CDH1) and Vimentin (VIM) were obtained from Co-expression analysis. C. Gene Ontology (GO) analysis observed up-regulated genes are associated with cell adhesion and down-regulated genes are relevant to cell migration. D. KEGG pathway enrichment analysis indicated up-regulated genes are associated with cell migration molecules and down-regulated genes are relevant to Wnt signaling pathway.