
Figure 1. Pathological changes in the kidney.
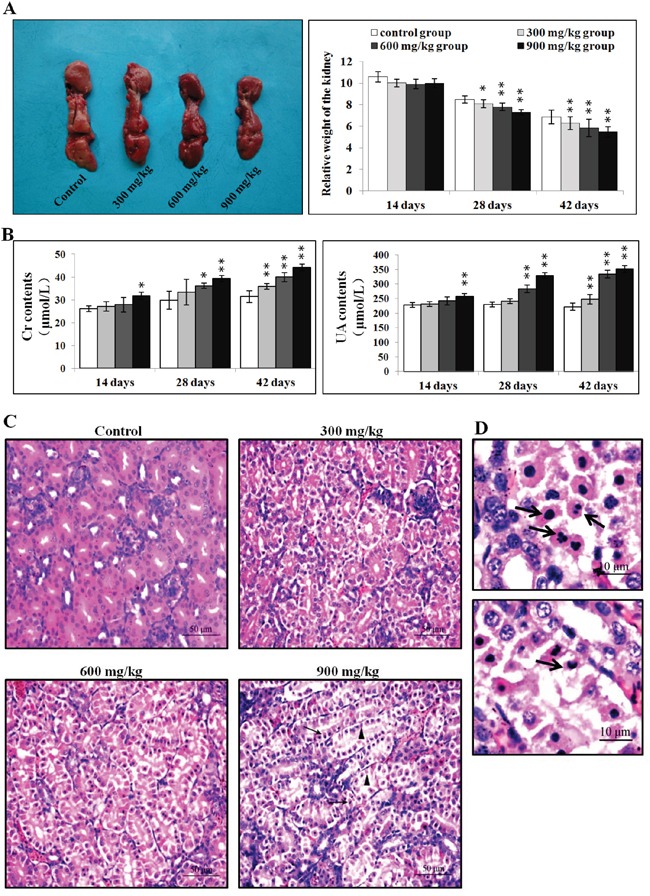
A. Changes in kidney size and relative weight at 42 d. B. Changes in serum creatinine and uric acid levels. C. Histopathological changes in the kidney at 42 d. Control group: no changes observed; 300 mg/kg group: tubular cells show granular and vacuolar degeneration, few necrotic tubular cells and apoptotic tubular cells are observed; 600 mg/kg group: tubular cells show marked granular and vacuolar degeneration, some necrotic tubular cells and apoptotic tubular cells are observed; 900 mg/kg group: Many necrotic tubular cells (▲) and apoptotic tubular cells (↑) are observed. (H·E ×400). D. Morphological changes in apoptotic cells. Apoptotic cell cytoplasm was intensely eosinophilic, and nuclei were shrunken, dense, ring-shaped or crescentic. Some apoptotic cell nuclei were cracked into two or multiple apoptotic bodies (↑). (H·E ×1000). Data are presented as means ± standard deviation (n=5). *P<0.05, **P<0.01 compared with the control group.