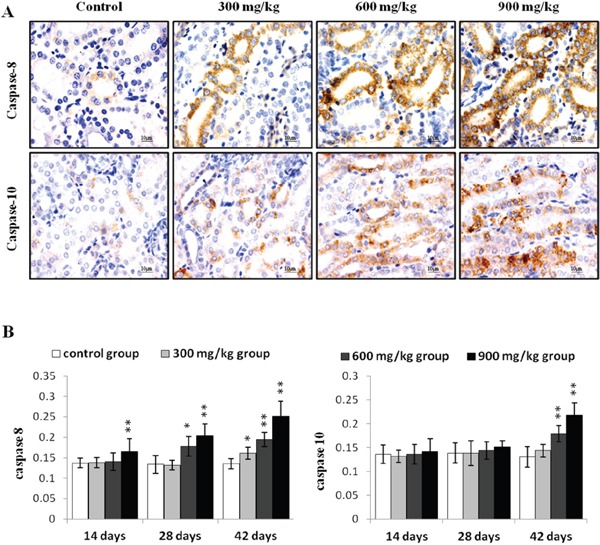
Figure 6. Immunohistochemical analysis of caspase-8 and caspase-10 in the kidney.

A. Representative immunohistochemical staining results for caspase-8 and caspase-10 in the kidney at 42 d. B. Quantification of caspase-8 and caspase-10 protein levels in the kidney. Data are presented as means ± standard deviation (n=5×5). *P<0.05, **P<0.01 compared with the control group.
