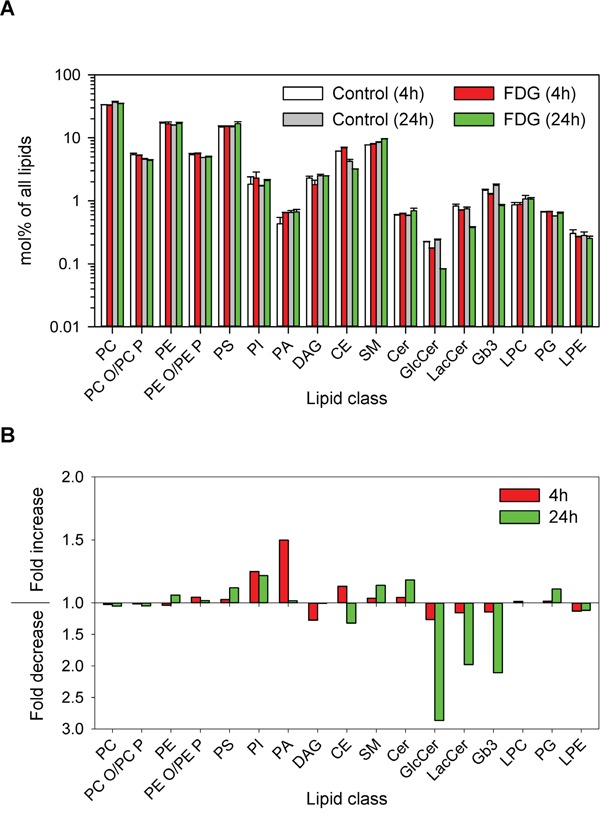
Figure 4. Changes in lipid composition after FDG treatment.

Cells were treated with or without 1 mM FDG for 4 or 24 h, and whole-cell lysates were analysed by MS. A. The relative amount of different lipid classes in the samples; the error bars show the deviation from the mean of two biological samples. B. Relative fold change in lipid classes after 4 and 24 h treatment with FDG compared to control samples.
