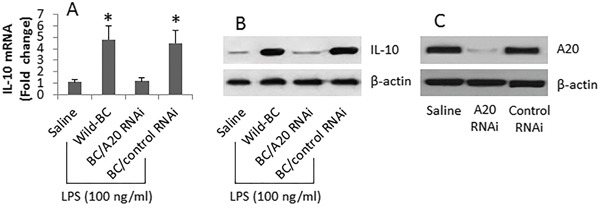
Figure 2. A20 is associated with IL-10 expression in B cells.

B cells were isolated from 6 healthy subjects and cultured for 3 days in the presence of LPS (100 ng/ml) and anti-CD40 (10 ng/ml). A-B., the bars indicate the IL-10 mRNA levels, the immune blots indicate the IL-10 protein levels, in the B cells after the treatment denoted on the X axis. C., the Western blots show the A20 gene knockdown results in the B cells. The data of bars are presented as mean ± SD. *, p<0.01, compared to the saline group. The data are representatives of 3 independent experiments.
