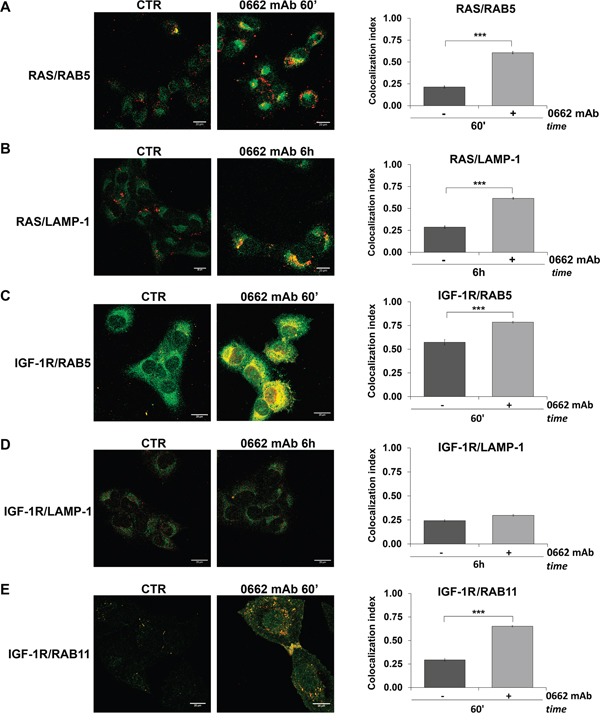
Figure 4. RAS and IGF-1R are sorted into early endosomes but the latter is recycled to the cell surface.

Confocal microscopy in U2/CD99wt57 before (CTR) and after 0662mAb treatment shows colocalization for: A. RAS (green) and RAB5 (red); B. RAS (green) and LAMP-1 (red); C. IGF-1R (green) and RAB5 (red); D. IGF-1R (green) and LAMP-1 (red); E. IGF-1R (red) and RAB11 (green) (scale bar 20μm). Representative images are displayed. Colocalization analysis was calculated by Nis Elements AR4.20.01 software (Nikon) and MCC was represented by histograms as mean values ± SEM. (***p<0.001, Student's t test).
