
Figure 1. MPC1 and MPC2 expressions in multiple organs and Western blotting results.
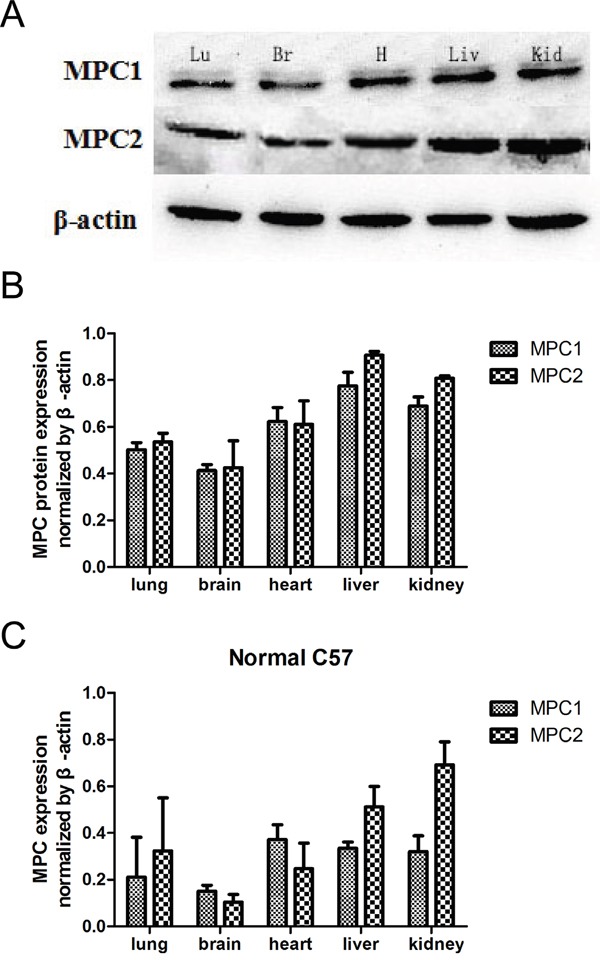
A. Western blotting shows variable expressions of MPC1 and MPC2 in different organs. B. Corresponding quantified densitometry of the Western blotting results as shown in (A). Date are presented as mean ± SEM (n=3 separate animals). C. Relative MPC mRNA levels in the indicated mouse tissues. Values are presented as mean ± SEM (n=3 separate animals). Br, brain; Lu, lung; H, heart; Liv, liver; Kid, kidney.