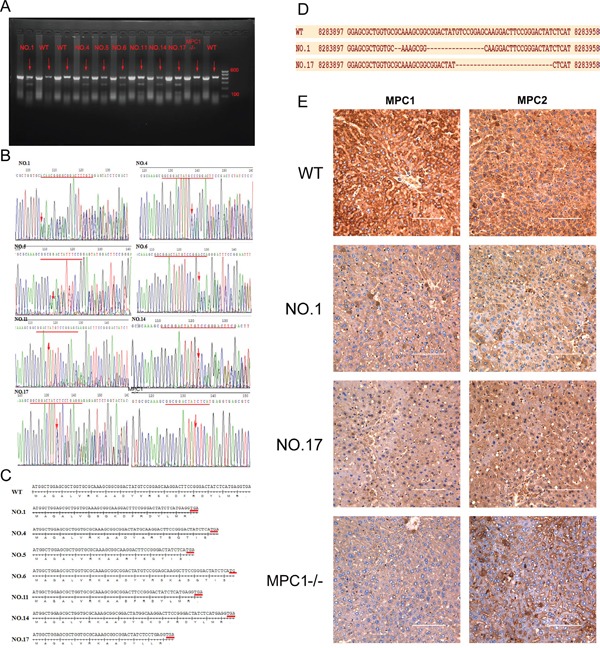
Figure 2. T7E1 assay, sequencing and Western blotting used for identification of gene KO mice.

A. The mutagenesis of the target sites is revealed by the presence of a full-length PCR product with digestion products of 278 and 150 bps (Marker shows in the picture from top to bottom: 600bp, 500bp, 400bp, 300bp, 200bp, 100bp). B. Sequence data of mutations in several mutation mice. Red lines indicate deletion of target(s). The red arrows indicate the beginning sites of deletion. C. The deleted base sequences of each heterozygous model relative to the WT one. D. shows single strand DNA sequences of WT, NO.1 and NO17 heterozygous mutation mice. E. shows results of IHC, on which the WT mice show strong expression of MPC1 and MPC2 proteins, while the NO1 and NO17 mice show reduced levels of the expression of MPC1 and MPC2 proteins, and the MPC1−/− mouse shows very weak MPC1 protein expression, but relatively weak MPC2 protein expression. Values are presented as mean ± SEM (n=3 separate animals).
