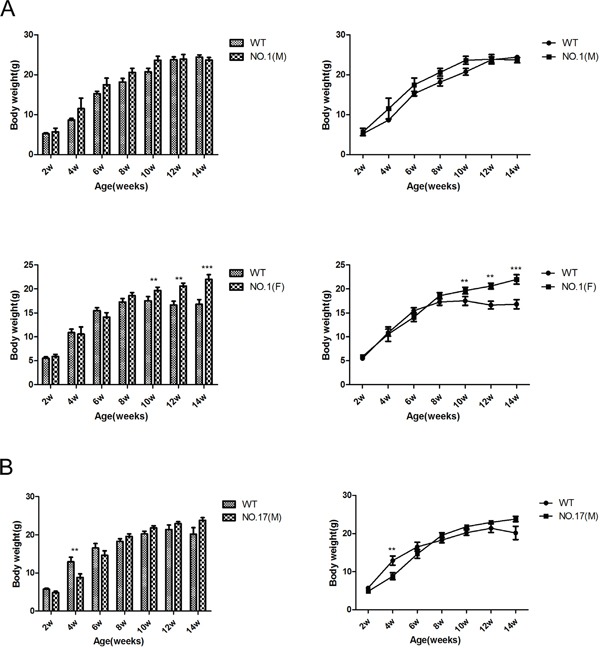
Figure 5. Effect of different heterozygous MPC1 KO on bodyweight.

A. Quantitative display of the bodyweight in NO.1 compared with WT mice. Upper part shows the bodyweight influence on the male mice, and the lower part shows the bodyweight influence on the female mice. B. Quantitative display of the bodyweight gain in NO.17 compared with WT mice. Upper part shows the bodyweight influence on the male mice, and the lower part shows the bodyweight influence on the female mice. Values are presented as mean ± SEM (n=7 separate animals, **<0.01, ***<0.001).
