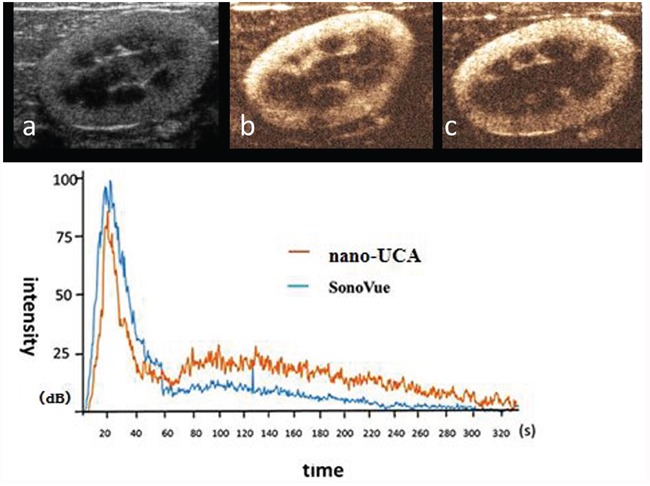
Figure 8. Two-dimensional ultrasonic imaging and ultrasound contrast enhanced imaging of UCAs in rabbit kidney and the time vs. intensity curve.

a. two-dimensional ultrasonic images of rabbit kidney, b. SonoVue US contrast enhanced image of rabbit kidney at the filling peak c. NPs ultrasound contrast enhanced image of rabbit kidney at the filling peak.
