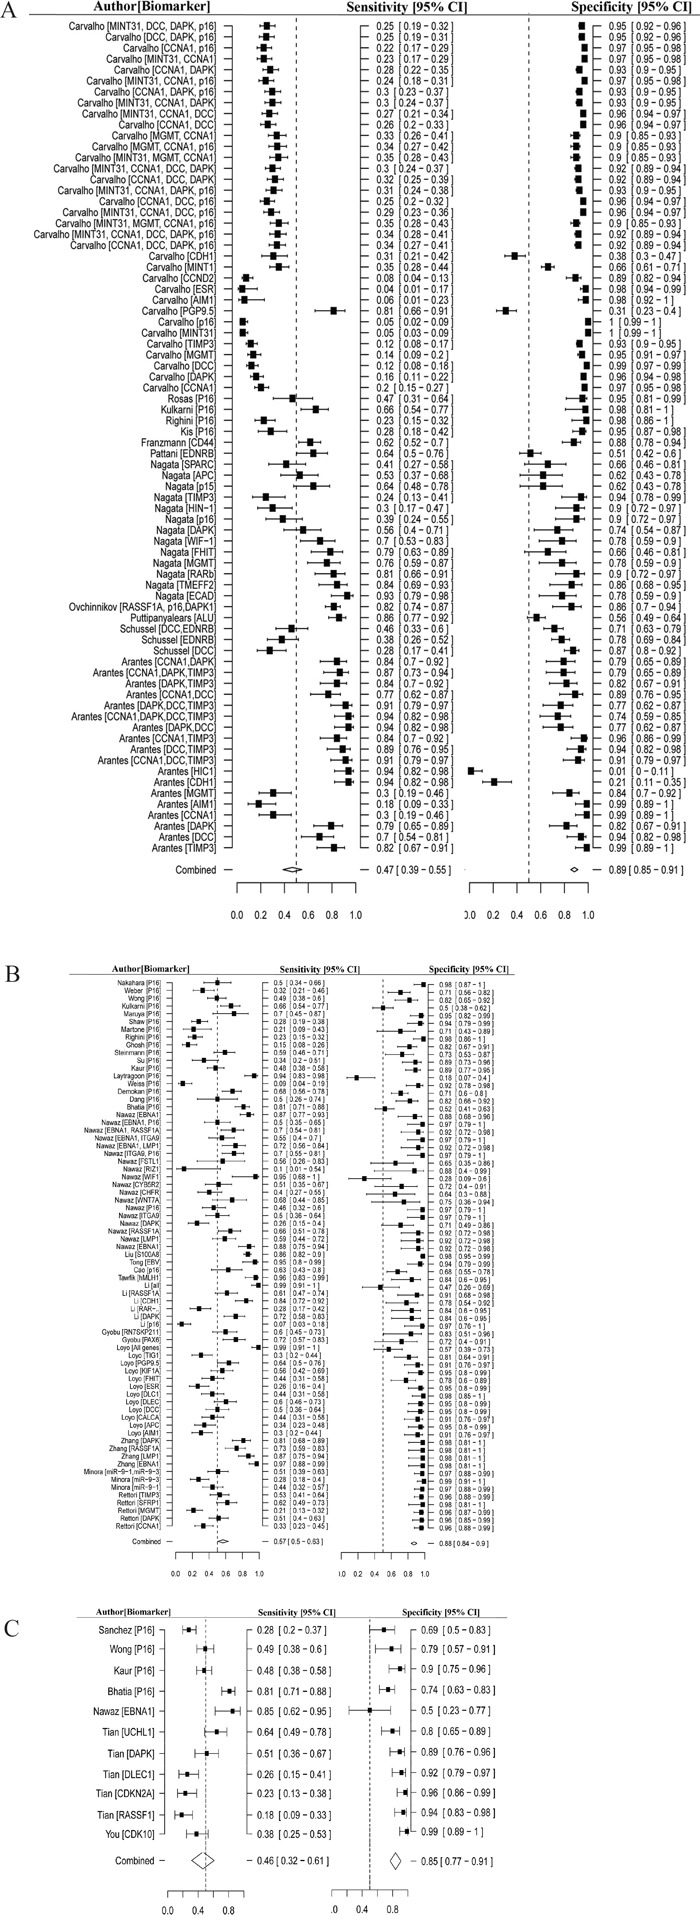
Figure 2. Forest plot of estimate of diagnostic accuracy using methylated biomarkers.

A. Forest plot of estimate of sensitivity and specificity of methylated biomarkers in saliva. B. Forest plot of estimate of sensitivity and specificity of methylated biomarkers in tissue. C. Forest plot of estimate of sensitivity and specificity of methylated biomarkers in blood.
