Figure 2.
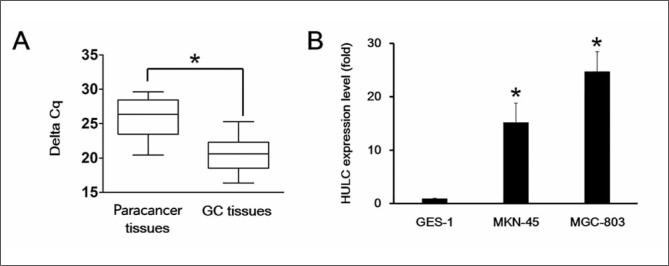
The expression levels of HULC were elevated in GC tissues and GC cell lines.
(A) The expression level of HULC was verified in paracancer tissues and GC tissues via qRT-PCR as indicated by the box plot ranges. The line indicates the average, whereas the whiskers are the standard deviations. (B) The expression level of HULC was elevated in human gastric cancer cell lines, MGC-803 and MKN-45, compared to wild-type gastric cell line, GES-1, by qRT-PCR.
Each experiment was repeated at least three times using independent biological replicates. *, p<0.05 compared with control.

