
Figure 1.
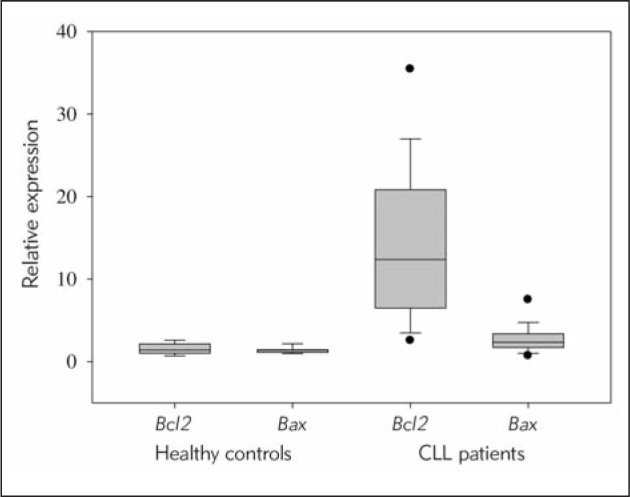
Relative expression of Bcl2 and Bax mRNA in CLL and non-leukemic samples.
qRT-PCR analysis showed a significantly higher expression of both Bcl2 and Bax in mononuclear cells of CLL patients (Bcl2 median 12.374; Bcl2 range 1.168–49.146; Bax median 2.346; Bax range 0.670–10.642) in comparison to healthy controls (Bcl2 median 1.411; Bcl2 range 0.685–2.629; Bax median 1.393; Bax range 0.972–2.243).