
Figure 3.
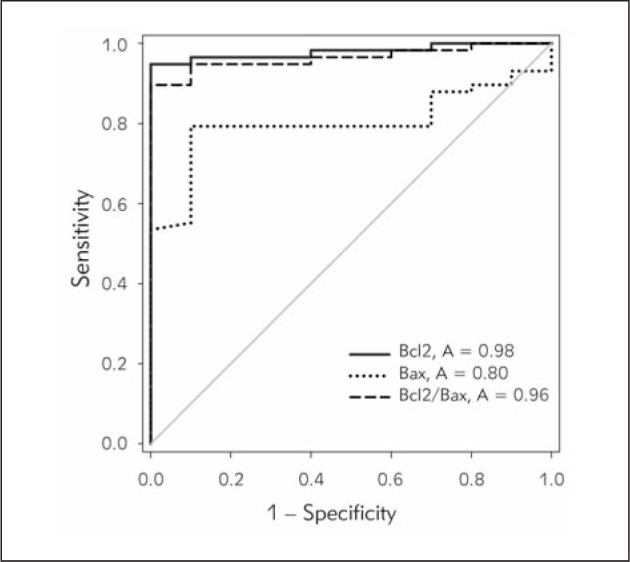
ROC analysis of Bcl2 and Bax expression and Bcl2/Bax ratio in CLL and non-leukemic samples.
Bcl2 mRNA expression and Bcl2/Bax mRNA ratio exert very high discriminatory power between CLL patients and healthy controls.
Bcl2: A=0.98, sensitivity=0.95, specificity=1.00, 95% CI=0.95–1.009, p<0.0001
Bcl2/Bax ratio: A=0.96, sensitivity=0.90, specificity=1.00, 95% CI=0.9230–1.005, p<0.0001
Bax: A=0.80, sensitivity=0.79, specificity=0.90, 95% CI=0.6920–0.9097, p=0.002514