
Fig. 4.
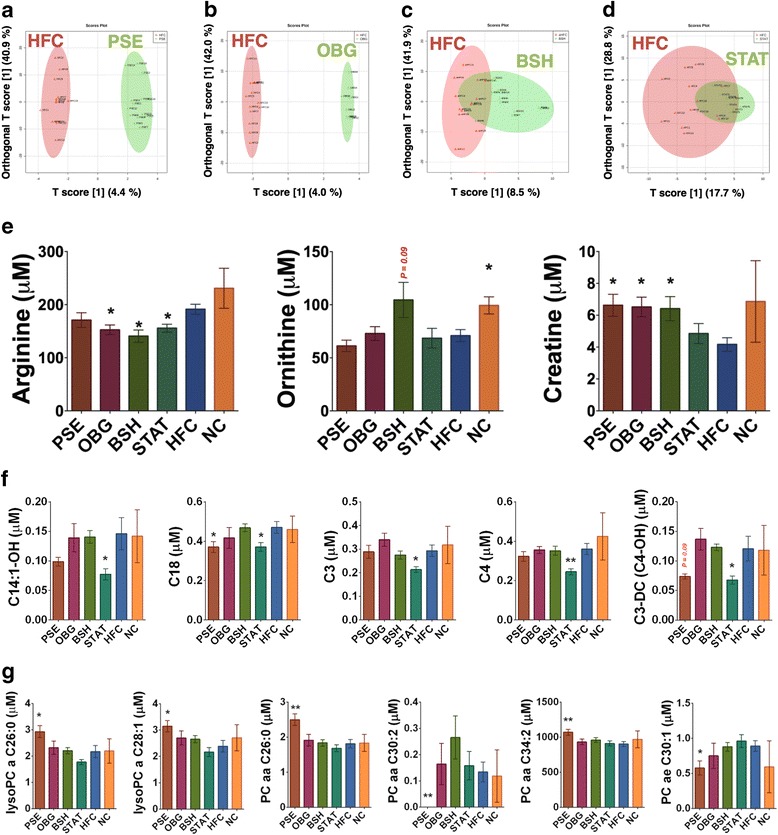
Effect of cardiovascular disease interventions on the host serum metabolome. Serum metabolome OPLS-DA: a PSE (green) vs. HFC (red). b OBG (green) vs. HFC (red). c BSH (red) vs. HFC (green). d STAT (green) vs. HFC (red). Significant differences in e amino acids and biogenic amines, f acylcarnatines, and g phosphotidylcholines in serum from each group, as analyzed by DI and LC-MS/MS. *(p < 0.05) and **(p < 0.01) represent significant differences when compared against HFC in one-way ANOVA. Plots depict individual replicates with mean and SEM