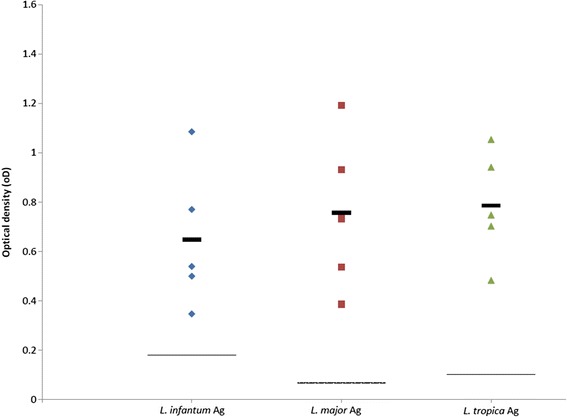
Fig. 4.

Scatter plot showing reactivity of five sera tested by ELISA from two dogs infected with Leishmania tropica. Seroreactivity was tested with antigens of L. infantum, L. major and L. tropica. Y-axis shows calibrated optical density (OD). The thick black line represents the mean value. The intermittent line represents the serological cut-off value. No significant differences were found between OD readings of the same sera with the different antigens (F (2,14) = 0.336, P = 0.721)
