
Figure 2.
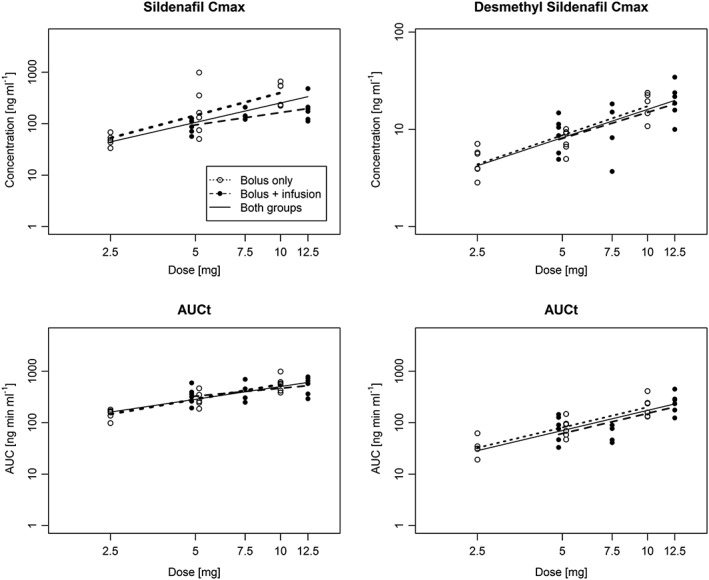
Dose proportionality analysis of AUC0‐tz and C max of sildenafil and desmethyl sildenafil. The slopes have been separately for dose levels with bolus only (open circles) and bolus + infusion (full circles). A common slope (solid line) has been estimated with separate intercepts for both subgroups (only the average intercept is presented)