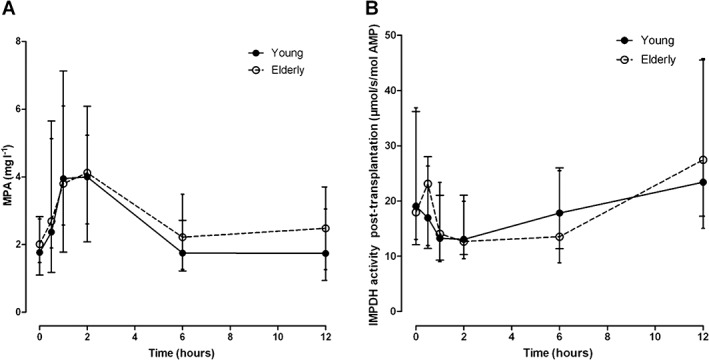
Figure 3.

MPA plasma concentration (Figure 3A) and IMPDH activity (Figure 3B) vs. time curve. The MPA exposure (MPA–AUC0–12h) was not significantly different between the two groups and there was also no significant difference at each individual time point between the two groups (Figure 3A). AEC0–12h was not significantly different between the two groups and there was also no significant difference at each time point between the two groups (Figure 3B)
